PV forecast: purely with weather and historical data

Most PV forecasts are based on standard weather models. However, these do not know whether a tree is shading your panels or how efficient your system really is in diffuse light. The solution: Historical comparison. We look at how much electricity your system has delivered in the past with exactly the same cloud cover: No matter what angle or how many different PV surfaces: Only the historical PV yields and cloud cover levels of past days are used: compared to the cloud cover forecast of today or the coming days. I have created an HACS extension for a quick setup. Alternatively, the forecast also works with Home Assistant Board means: purely the standard weather forecast and an SQL sensor with value template. Optionally, a markdown card can be created to display the cloud cover levels in order to understand the calculation:

The problem with traditional PV forecasts
External PV forecasting services (Forecast.Solar, Solcast & Co.) estimate the yield on the basis of weather data and configured system output. This works for rough planning, but is often too inaccurate for daily operation:
- The actual shading caused by trees, buildings or snow is not taken into account
- The effective output of the system (ageing, soiling) is unknown
- Local weather phenomena such as ground fog or rapidly changing cloud cover are incorrectly assessed
Better: The knowledge about the yield and cloud cover is already in the Home Assistant database - you just have to read it out.
HACS integration
| Software | Ha_pv_history_forecast |
|---|---|
| GitHub | https://github.com/LiBe-net/ha_pv_history_forecast |
| current version | 0.2.3 |
| found | 2026-05-01 |
- Seasonally scaled - a summer day is normalized to the current autumn day, taking into account day length and sun position (astronomically correct formula by latitude)
- Dynamically UV-weighted - the distance metric combines cloud cover and UV index distance; in the case of heavy cloud cover (≥60 %), the UV weighting automatically increases from 30 % to up to 70 % because the UV index is then the more precise discriminator
- Recency-weighted - days younger than 30 days receive up to 30% more weighting (current plant behavior counts more)
- LOO-validated - leave-one-out cross-validation automatically recognizes and downweights outliers in the pool
- Trend-attenuated - if the most recent 14 days are more than 15 % above the older average, half of the surplus is deducted
- Back-test driven - the carry-through factor for yesterday's reduced yield is derived from consecutive bad weather pairs in the pool based on data
- Cloud-gated penalty - if a reduced yield occurred yesterday and ≥60 % cloud cover is also forecast today, the forecast is conservatively adjusted
- Averaged or interpolated - depending on the available data (weighted average, light reduction or max assumption)
Generated sensors
After installation and configuration (default prefix: `pv_hist`), the following sensors are available:
| Sensor | meaning |
| sensor.pv_hist_remaining_today | Expected remaining yield today in kWh (main sensor) |
| sensor.pv_hist_remaining_min | Pessimistic daily remainder (cloudy similar days) |
| sensor.pv_hist_remaining_max | Optimistic daily residual (brighter similar days) |
| sensor.pv_hist_tomorrow | Weighted forecast for the total yield tomorrow in kWh |
| sensor.pv_hist_weather_forecast | Internal auxiliary sensor: hourly weather forecast as JSON |
| sensor.pv_hist_cloud_coverage | Auto-cloud sensor: mirrors cloud_coverage of the weather entity (if no external sensor selected); usable from day 1, LTS history (>10 days) builds up automatically |
| sensor.pv_hist_cloud_remaining_today | Average of the remaining cloud cover within the hours of sunshine for the remaining day |
| sensor.pv_hist_cloud_tomorrow | Average of the remaining cloud cover within the hours of sunshine for the coming day |
| sensor.pv_hist_method_remaining_today | Method used to calculate the forecast for today |
| sensor.pv_hist_method_tomorrow | Method used to calculate the forecast for the coming day |
| sensor.pv_hist_uv_remaining_today | Average UV index for the remainder of today (within the hours of sunshine) |
| sensor.pv_hist_uv_tomorrow | Average UV index for the coming day (within the hours of sunshine) |
| sensor.pv_hist_uv | Auto UV sensor: reflects the UV index of the weather entity (if no external UV sensor is selected); builds LTS history automatically |
The main sensor `sensor.pv_hist_remaining_today` also contains the attributes `lovelace_card_remaining_today` and `lovelace_card_tomorrow` - ready-rendered Markdown cards that can be integrated directly into the dashboard.
Simplified function:
- cloud_history: Reads historical cloud cover values from the HA statistics (LTS)
- matching_days: Searches for days on which the cloud cover average in the rest of the day is similar to the current one
- final_data: Calculates the scaled yield for each comparison day and returns the result as JSON
The scaling between the comparison day and today's day is carried out using an astronomically correct day length formula:
dl = 24/π · arccos(−tan(φ) · tan(δ))
δ  = −0.4093 · cos(2π · (Tag + 10) / 365)
In addition, there is a seasonal snow detection (December-February): If yesterday's yield was conspicuously low given the available solar potential, a snow factor is applied.
Installation
Add via this link:
Or alternatively installed as a custom repository: Open HACS → ⋮ → Add custom repository

URL:
LiBe-net/ha_pv_history_forecast- In HACS: Search for and install "PV History Forecast"
- Restart Home Assistant
- Settings → Devices & Services → Integrations → Add "PV History Forecast"
Configuration
Configuration is carried out completely via the HA user interface in two steps.
Step 1 - Prefix & database
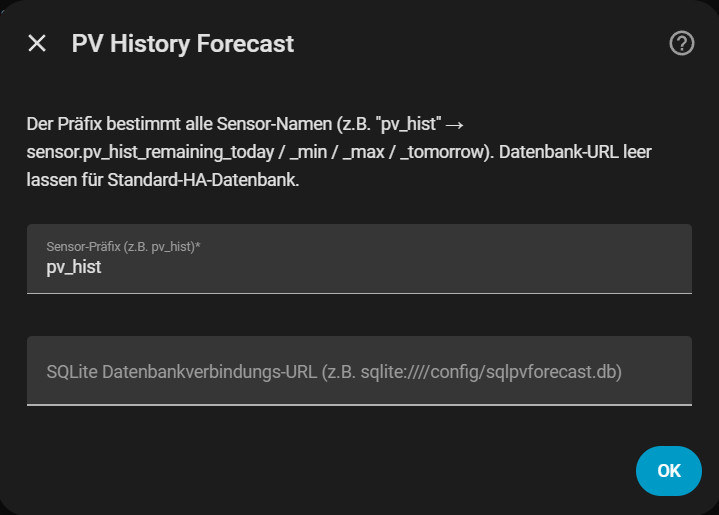
| Field | Default field | Field Description |
| Sensor prefix | pv_hist | Basis for all sensor names |
| Database path | (empty) | Leave empty = standard HA database |
Step 2 - Sensors
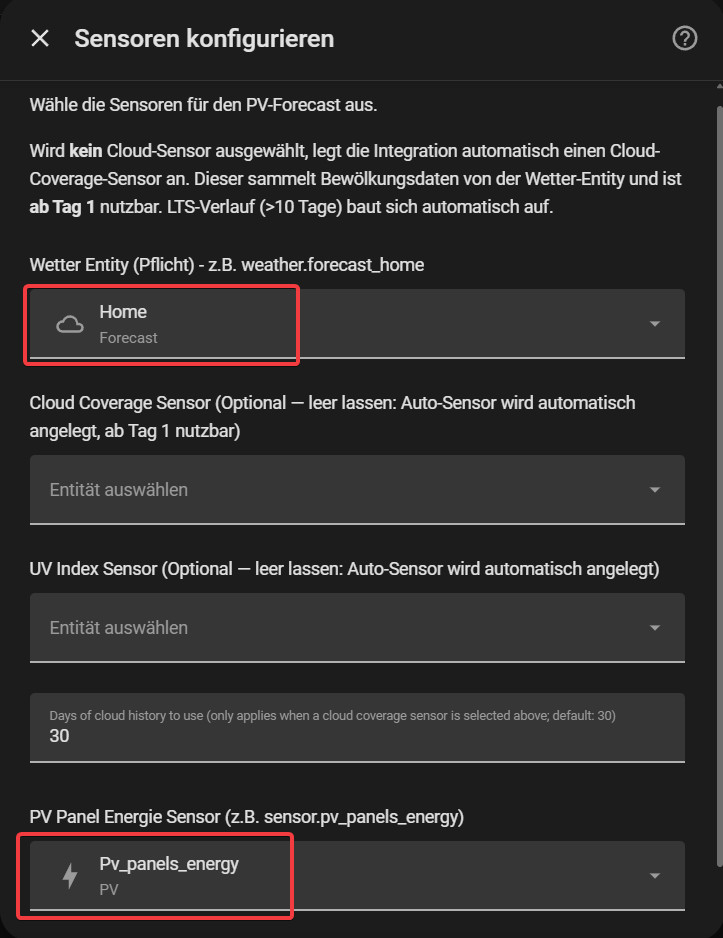
| Field | Mandatory | Field Description |
| Weather entity | ✅ | `weather.*` entity, e.g. `weather.forecast_home` |
| PV energy sensor | ✅ | Sensor with `device_class: energy` and active statistics; Wh is automatically converted to kWh |
| Cloud sensor | Optional | Sensor with unit %; leave empty = sensor.pv_hist_cloud_coverage is created automatically(can be used from day 1) |
| UV index sensor | Optional | Sensor for historical UV index values (improves weighting in clear skies); leave empty = sensor.pv_hist_uv is created automatically |
| History days | Default: 30 | Number of historical days for comparison |
Tip: The dropdowns in the configuration step only show suitable sensors - PV sensors are filtered by `device_class: energy` and active statistics, cloud sensors by unit `%`.
The Lovelace Dashboard
The finished markdown maps are available as an attribute of the main sensor and show
- The calculated remaining forecast in kWh as a headline
- The current cloud cover average and the calculation method used
- A table of historical comparison days with daily cloudiness, daily yield, residual cloudiness, residual yield and percentage influence weight
Integration into a Lovelace Markdown-Card today:
type: markdown
content: |
  Vorhersage heute verbleibend: {{ states.sensor.pv_hist_remaining_today.state | round(2)}} kWh
  restliche Bewölkung: {{ states.sensor.pv_hist_cloud_remaining_today.state }}%

  {{ state_attr('sensor.pv_hist_remaining_today', 'lovelace_card_remaining_today') }}
tomorrow:
type: markdown
content: |
  Vorhersage morgen: {{ states.sensor.pv_hist_tomorrow.state | round(2)}} kWh
  Bewölkung morgen: {{ states.sensor.pv_hist_cloud_tomorrow.state }}%

{{ state_attr('sensor.pv_hist_remaining_today', 'lovelace_card_tomorrow') }}
Requirements
- Home Assistant 2024.1.0 or newer
- Standard database (sqlite)
- HACS installed and set up
- PV sensor:
state_class: total_increasing, unitkWhorWh, active statistics - Weather entity with
cloud_coveragein the forecast response (e.g.weather.forecast_home) - Optional: external cloud sensor with
%unit (otherwise: auto sensor can be used from day 1) - Optional: external UV index sensor (otherwise: auto sensor can be used from day 1)
Without HACS: purely with SQL integration
Before I created the HACS integration on Github, I implemented the prediction purely using the SQL integration: Rebuild here:
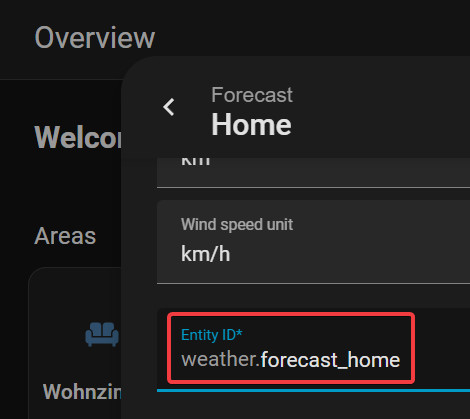
Requirements Sensor for weather forecast
Sensor name normally: weather.forecast_home
Save forecast data
Customization: configuration.yaml: Save weather forecast in a sensor: weather.forecast_hourly
template:
  - trigger:
      - platform: time_pattern
        minutes: /15
    action:
      - service: weather.get_forecasts
        data:
          type: hourly
        target:
          entity_id: weather.forecast_home
        response_variable: hourly
    sensor:
      - name: weather.forecast_hourly
        unique_id: weather.forecast_hourly
        state: "{{ now().isoformat() }}"
        attributes:
          forecast:  "{{ hourly['weather.forecast_home'].forecast }}"
Optional: Use more than 10 days for the calculation.
For more than 10 days we need an auxiliary sensor so that the cloud cover values are written to the long-term statistics.
Sensor name: weather.cloud_coverage
{{ state_attr("weather.home",'cloud_coverage') | float}}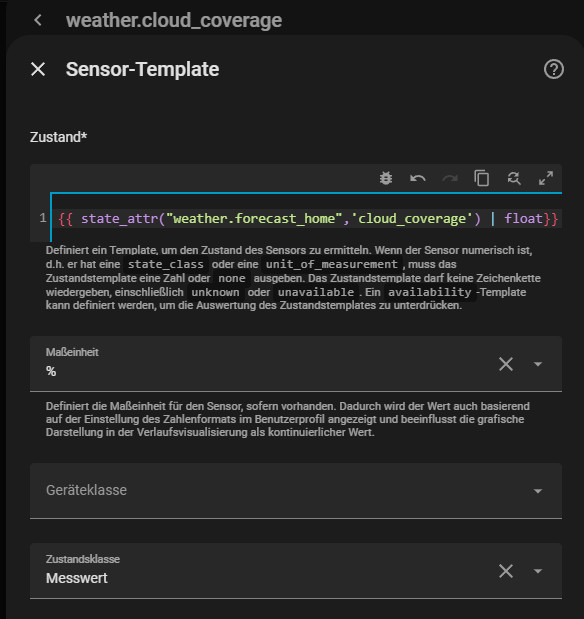
And for the UV index:
Sensor name: weather.uv_index
{{ state_attr("weather.home",'uv_index') | float}}SQL sensor with value template
The following source sensors are required for the SQL sensor:
weather.forecast_home- provides historical cloudcoverageand UV index directly from the state attributessensor.weather_forecast_hourly- hourly forecast (attachment inconfiguration.yamlas described above)sensor.pv_panels_energy- total counter for the PV yield(state_class: total_increasing, unitkWh)
The three sensor names are adapted in the vars-CTE of the SQL. The query corresponds to the logic of the HACS integration and returns the same JSON format: cloud cover, UV index and PV yields per comparison day.

WITH vars AS (
    SELECT
        'weather.forecast_home' as sensor_clouds,   -- Weather entity direct: cloud_coverage from state_attributes
        'weather.forecast_home' as sensor_uv,   -- Weather entity direct: uv_index from state_attributes
        'sensor.pv_panels_energy' as sensor_pv,
        'sensor.weather_forecast_hourly' as sensor_forecast,
        -- Calculates the offset between local time and UTC (e.g. '+3600 seconds')
        -- Used to trigger the date change (00:00) locally
        (strftime('%s', 'now', 'localtime') - strftime('%s', 'now')) || ' seconds' as offset
),

ids AS (
    /* Retrieves all required internal IDs for statistics and states from the HA database */
    SELECT
        (SELECT id FROM statistics_meta WHERE statistic_id = (SELECT sensor_clouds FROM vars)) as w_id_stats,
        (SELECT metadata_id FROM states_meta WHERE entity_id = (SELECT sensor_clouds FROM vars)) as w_id_states,
        (SELECT id FROM statistics_meta WHERE statistic_id = (SELECT sensor_uv FROM vars)) as uv_id_stats,
        (SELECT metadata_id FROM states_meta WHERE entity_id = (SELECT sensor_uv FROM vars)) as uv_id_states,
        (SELECT id FROM statistics_meta WHERE statistic_id = (SELECT sensor_pv FROM vars) LIMIT 1) as p_id,
        (SELECT metadata_id FROM states_meta WHERE entity_id = (SELECT sensor_pv FROM vars) LIMIT 1) as p_id_states,
        (SELECT metadata_id FROM states_meta WHERE entity_id = (SELECT sensor_forecast FROM vars) LIMIT 1) as f_id,
        (SELECT metadata_id FROM states_meta WHERE entity_id = 'sun.sun') as sun_id
),

pv_activity AS (
    /* Sunrise = first 'above_horizon' entry yesterday (UTC epoch, directly correct)       */
    /* Sunset = first 'below_horizon' entry AFTER sunrise yesterday                         */
    /* sun_start/sun_end = UTC HH:MM  → used for BETWEEN with UTC forecast datetimes (+00:00) */
    /* sun_start_local/sun_end_local = local HH:MM → only for phase detection (before/after sunrise/sunset)  */
    SELECT
        COALESCE((
            SELECT strftime('%H:%M', last_updated_ts, 'unixepoch')
            FROM states
            WHERE metadata_id = (SELECT sun_id FROM ids)
              AND date(last_updated_ts, 'unixepoch', (SELECT offset FROM vars)) = date('now', (SELECT offset FROM vars), '-1 day')
              AND state = 'above_horizon'
            ORDER BY last_updated_ts ASC LIMIT 1
        ), '05:30') as sun_start,
        COALESCE((
            SELECT strftime('%H:%M', last_updated_ts, 'unixepoch')
            FROM states
            WHERE metadata_id = (SELECT sun_id FROM ids)
              AND state = 'below_horizon'
              AND last_updated_ts > (
                  SELECT last_updated_ts FROM states
                  WHERE metadata_id = (SELECT sun_id FROM ids)
                    AND date(last_updated_ts, 'unixepoch', (SELECT offset FROM vars)) = date('now', (SELECT offset FROM vars), '-1 day')
                    AND state = 'above_horizon'
                  ORDER BY last_updated_ts ASC LIMIT 1
              )
            ORDER BY last_updated_ts ASC LIMIT 1
        ), '17:30') as sun_end,
        COALESCE((
            SELECT strftime('%H:%M', last_updated_ts, 'unixepoch', (SELECT offset FROM vars))
            FROM states
            WHERE metadata_id = (SELECT sun_id FROM ids)
              AND date(last_updated_ts, 'unixepoch', (SELECT offset FROM vars)) = date('now', (SELECT offset FROM vars), '-1 day')
              AND state = 'above_horizon'
            ORDER BY last_updated_ts ASC LIMIT 1
        ), '06:30') as sun_start_local,
        COALESCE((
            SELECT strftime('%H:%M', last_updated_ts, 'unixepoch', (SELECT offset FROM vars))
            FROM states
            WHERE metadata_id = (SELECT sun_id FROM ids)
              AND state = 'below_horizon'
              AND last_updated_ts > (
                  SELECT last_updated_ts FROM states
                  WHERE metadata_id = (SELECT sun_id FROM ids)
                    AND date(last_updated_ts, 'unixepoch', (SELECT offset FROM vars)) = date('now', (SELECT offset FROM vars), '-1 day')
                    AND state = 'above_horizon'
                  ORDER BY last_updated_ts ASC LIMIT 1
              )
            ORDER BY last_updated_ts ASC LIMIT 1
        ), '18:30') as sun_end_local
    FROM ids
),

forecast_val AS (
    /* Calculates the average cloud coverage + UV index for the remaining part of the current day */
    SELECT COALESCE(
        (SELECT AVG(CAST(json_extract(f.value, '$.cloud_coverage') AS FLOAT))
         FROM states s
         JOIN state_attributes a ON s.attributes_id = a.attributes_id,
         json_each(a.shared_attrs, '$.forecast') f
         WHERE s.metadata_id = (SELECT f_id FROM ids)
           AND s.last_updated_ts = (SELECT MAX(last_updated_ts) FROM states WHERE metadata_id = (SELECT f_id FROM ids))
           -- Match forecast date against local "today" (via UTC offset)
           AND substr(json_extract(f.value, '$.datetime'), 1, 10) = date('now', (SELECT offset FROM vars))
           AND substr(json_extract(f.value, '$.datetime'), 12, 5)
               BETWEEN CASE
                         -- Forecast slots are UTC: compare against UTC sun_start/sun_end.
                         -- Only the window START shifts: during local day use current UTC time
                         -- (remaining today); before/after local daylight use full-day window
                         -- (midnight use-case: forecast for the whole coming day).
                         WHEN strftime('%H:%M', 'now', (SELECT offset FROM vars))
                              BETWEEN (SELECT sun_start_local FROM pv_activity)
                                  AND (SELECT sun_end_local   FROM pv_activity)
                             THEN strftime('%H:%M', 'now')
                         ELSE (SELECT sun_start FROM pv_activity)
                       END
               AND (SELECT sun_end FROM pv_activity)
        ), 50.0) as f_avg,
        COALESCE(
        (SELECT AVG(CAST(json_extract(f.value, '$.uv_index') AS FLOAT))
         FROM states s
         JOIN state_attributes a ON s.attributes_id = a.attributes_id,
         json_each(a.shared_attrs, '$.forecast') f
         WHERE s.metadata_id = (SELECT f_id FROM ids)
           AND s.last_updated_ts = (SELECT MAX(last_updated_ts) FROM states WHERE metadata_id = (SELECT f_id FROM ids))
           AND substr(json_extract(f.value, '$.datetime'), 1, 10) = date('now', (SELECT offset FROM vars))
           AND substr(json_extract(f.value, '$.datetime'), 12, 5)
               BETWEEN CASE
                         WHEN strftime('%H:%M', 'now', (SELECT offset FROM vars))
                              BETWEEN (SELECT sun_start_local FROM pv_activity)
                                  AND (SELECT sun_end_local   FROM pv_activity)
                             THEN strftime('%H:%M', 'now')
                         ELSE (SELECT sun_start FROM pv_activity)
                       END
               AND (SELECT sun_end FROM pv_activity)
        ), 0.0) as uv_avg
),

forecast_next_day AS (
    /* Calculates the average cloud coverage + UV index for the entire next day */
    SELECT COALESCE((
        SELECT AVG(CAST(json_extract(f.value, '$.cloud_coverage') AS FLOAT))
        FROM states s
        JOIN state_attributes a ON s.attributes_id = a.attributes_id,
        json_each(a.shared_attrs, '$.forecast') f
        WHERE s.metadata_id = (SELECT f_id FROM ids)
          AND s.last_updated_ts = (SELECT MAX(last_updated_ts) FROM states WHERE metadata_id = (SELECT f_id FROM ids))
          AND substr(json_extract(f.value, '$.datetime'), 1, 10) = date('now', (SELECT offset FROM vars), '+1 day')
          AND substr(json_extract(f.value, '$.datetime'), 12, 5) BETWEEN (SELECT sun_start FROM pv_activity) AND (SELECT sun_end FROM pv_activity)
    ), 50.0) as f_avg_tomorrow,
    COALESCE((
        SELECT AVG(CAST(json_extract(f.value, '$.uv_index') AS FLOAT))
        FROM states s
        JOIN state_attributes a ON s.attributes_id = a.attributes_id,
        json_each(a.shared_attrs, '$.forecast') f
        WHERE s.metadata_id = (SELECT f_id FROM ids)
          AND s.last_updated_ts = (SELECT MAX(last_updated_ts) FROM states WHERE metadata_id = (SELECT f_id FROM ids))
          AND substr(json_extract(f.value, '$.datetime'), 1, 10) = date('now', (SELECT offset FROM vars), '+1 day')
          AND substr(json_extract(f.value, '$.datetime'), 12, 5) BETWEEN (SELECT sun_start FROM pv_activity) AND (SELECT sun_end FROM pv_activity)
    ), 0.0) as uv_avg_tomorrow
),

cloud_history AS (
        /* Combines long-term statistics and short-term states of cloud coverage for historical comparison */
        SELECT start_ts as ts,
                     CAST(COALESCE(mean, state) AS FLOAT) as val
        FROM statistics
        WHERE metadata_id = (SELECT w_id_stats FROM ids)
            AND start_ts > strftime('%s', 'now', '-60 days')
        UNION ALL
        SELECT s.last_updated_ts as ts,
            CASE WHEN (SELECT sensor_clouds FROM vars) LIKE 'weather.%'
                     THEN CAST(json_extract(a.shared_attrs, '$.cloud_coverage') AS FLOAT)
                     ELSE CAST(s.state AS FLOAT)
            END as val
        FROM states s
        LEFT JOIN state_attributes a ON s.attributes_id = a.attributes_id
        WHERE s.metadata_id = (SELECT w_id_states FROM ids)
            AND ((SELECT sensor_clouds FROM vars) LIKE 'weather.%' OR NOT EXISTS (SELECT 1 FROM statistics WHERE metadata_id = (SELECT w_id_stats FROM ids)))
            AND s.last_updated_ts > strftime('%s', 'now', '-10 days')
            AND s.state NOT IN ('unknown', 'unavailable', '')
),

uv_history AS (
        /* Combines long-term statistics and short-term states of UV index for historical comparison */
        SELECT start_ts as ts,
                     CAST(COALESCE(mean, state) AS FLOAT) as uv_val
        FROM statistics
        WHERE metadata_id = (SELECT uv_id_stats FROM ids)
            AND start_ts > strftime('%s', 'now', '-60 days')
        UNION ALL
        SELECT s.last_updated_ts as ts,
            CASE WHEN (SELECT sensor_uv FROM vars) LIKE 'weather.%'
                     THEN CAST(json_extract(a.shared_attrs, '$.uv_index') AS FLOAT)
                     ELSE CAST(s.state AS FLOAT)
            END as uv_val
        FROM states s
        LEFT JOIN state_attributes a ON s.attributes_id = a.attributes_id
        WHERE s.metadata_id = (SELECT uv_id_states FROM ids)
            AND ((SELECT sensor_uv FROM vars) LIKE 'weather.%' OR NOT EXISTS (SELECT 1 FROM statistics WHERE metadata_id = (SELECT uv_id_stats FROM ids)))
            AND s.last_updated_ts > strftime('%s', 'now', '-10 days')
            AND s.state NOT IN ('unknown', 'unavailable', '')
),

matching_days AS (
    /* Finds past days whose cloud and UV profile most closely matches today's forecast */
    SELECT
        date(c.ts, 'unixepoch') as day,
        AVG(CASE WHEN strftime('%H:%M', c.ts, 'unixepoch') BETWEEN (SELECT sun_start FROM pv_activity) AND (SELECT sun_end FROM pv_activity) THEN c.val END) as h_avg_total_val,
        AVG(CASE WHEN strftime('%H:%M', c.ts, 'unixepoch') >= strftime('%H:00', 'now') AND strftime('%H:%M', c.ts, 'unixepoch') <= (SELECT sun_end FROM pv_activity) THEN c.val END) as h_avg_rest_val,
        AVG(CASE WHEN strftime('%H:%M', u.ts, 'unixepoch') BETWEEN (SELECT sun_start FROM pv_activity) AND (SELECT sun_end FROM pv_activity) THEN u.uv_val END) as uv_avg_total_val,
        AVG(CASE WHEN strftime('%H:%M', u.ts, 'unixepoch') >= strftime('%H:00', 'now') AND strftime('%H:%M', u.ts, 'unixepoch') <= (SELECT sun_end FROM pv_activity) THEN u.uv_val END) as uv_avg_rest_val
    FROM cloud_history c
    JOIN uv_history u ON date(c.ts, 'unixepoch') = date(u.ts, 'unixepoch')
    -- Filtert die Historie: Alles vor dem heutigen lokalen Tag (Offset-gesteuert)
    WHERE date(c.ts, 'unixepoch') < date('now', (SELECT offset FROM vars))
    GROUP BY 1
    HAVING h_avg_total_val IS NOT NULL AND h_avg_total_val > 0
    ORDER BY ABS(
        COALESCE(h_avg_rest_val, h_avg_total_val) -- Fallback auf Gesamt-Schnitt wenn Rest null ist
        - (SELECT f_avg FROM forecast_val)
    ) ASC
),

final_data AS (
    /* Determines the actual PV yields of the best matching historical days */
    SELECT
        md.*,
        (SELECT MAX(state) FROM statistics WHERE metadata_id = (SELECT p_id FROM ids) AND date(start_ts, 'unixepoch') = md.day) as day_max,
        (SELECT MIN(state) FROM statistics WHERE metadata_id = (SELECT p_id FROM ids) AND date(start_ts, 'unixepoch') = md.day AND state > 0) as day_min,
        COALESCE((SELECT state FROM statistics WHERE metadata_id = (SELECT p_id FROM ids) AND date(start_ts, 'unixepoch') = md.day AND strftime('%H', start_ts, 'unixepoch') = strftime('%H', 'now') LIMIT 1), (SELECT MIN(state) FROM statistics WHERE metadata_id = (SELECT p_id FROM ids) AND date(start_ts, 'unixepoch') = md.day AND state > 0)) as h_hour_curr,
        COALESCE((SELECT state FROM statistics WHERE metadata_id = (SELECT p_id FROM ids) AND date(start_ts, 'unixepoch') = md.day AND strftime('%H', start_ts, 'unixepoch') = strftime('%H', 'now', '-1 hour') LIMIT 1), (SELECT MIN(state) FROM statistics WHERE metadata_id = (SELECT p_id FROM ids) AND date(start_ts, 'unixepoch') = md.day AND state > 0)) as h_hour_prev
    FROM matching_days md
)

/* Generates the final JSON object for Home Assistant */
SELECT json_group_array(
    json_object(
        'date', day,
        'f_avg_today_remaining', (SELECT ROUND(f_avg, 1) FROM forecast_val),
        'f_avg_tomorrow', (SELECT ROUND(f_avg_tomorrow, 1) FROM forecast_next_day),
        'uv_avg_today_remaining', (SELECT ROUND(uv_avg, 1) FROM forecast_val),
        'uv_avg_tomorrow', (SELECT ROUND(uv_avg_tomorrow, 1) FROM forecast_next_day),
        'h_avg_total', ROUND(h_avg_total_val, 1),
        /* COALESCE: before sunrise h_avg_rest_val is NULL (UTC window '23:xx'..'17:xx' empty) */
        /* Fall back to h_avg_total_val so Jinja cloud-matching works correctly at midnight.   */
        'h_avg_remaining', ROUND(COALESCE(h_avg_rest_val, h_avg_total_val), 1),
        'uv_avg_total', ROUND(uv_avg_total_val, 1),
        'uv_avg_remaining', ROUND(COALESCE(uv_avg_rest_val, uv_avg_total_val), 1),
        'yield_day_total', ROUND(day_max - day_min, 2),
        'yield_day_remaining', ROUND(CASE
            WHEN strftime('%H:%M', 'now', (SELECT offset FROM vars)) > (SELECT sun_end_local   FROM pv_activity)
                THEN 0.0
            WHEN strftime('%H:%M', 'now', (SELECT offset FROM vars)) < (SELECT sun_start_local FROM pv_activity)
                THEN (day_max - day_min)
            ELSE MAX(0,
                ((h_hour_curr - h_hour_prev) * (1.0 - (CAST(strftime('%M', 'now') AS FLOAT) / 60.0)) *
                  CASE
                    WHEN strftime('%H', 'now') = strftime('%H', (SELECT sun_start FROM pv_activity)) THEN 0.85
                    WHEN strftime('%H', 'now') = strftime('%H', (SELECT sun_end FROM pv_activity)) THEN 0.70
                    ELSE 1.0
                  END)
                + (day_max - h_hour_curr)
            )
        END, 2),
        'pv_start', (SELECT sun_start FROM pv_activity),
        'pv_end', (SELECT sun_end FROM pv_activity)
    )
) as json FROM final_data WHERE day_max > 0;
If you have created your own template sensor for the degree of cloudiness as described above, this must first collect data for a few days. The variable 'weather.forecast_home' as sensor_clouds can then be replaced by the template sensor:
...
 'sensor.weather_cloud_coverage' as sensor_clouds,
 'sensor.weather_uv_index' as sensor_uv,
...
This means that more than 10 days can be used to determine the PV forecast.
The SQL query returns a JSON object with cloud cover, UV index and PV yield for each comparison day. The matching uses a combination of cloud cover and UV deviation (70 % / 30 % weighted) and favors younger days with a recency bonus (up to +30 % for days <30 days old). The best 15 hits are used as the basis for calculation.
Value template (main sensor - remaining today)
The SQL sensor name is: sensor.pv_remaining_states (attribute: json). The template reads this attribute and calculates the remaining forecast - identical logic as the HACS integration with UV weighting, recency boost and top 15 selection:
{# PV FORECAST: Remaining yield today – weighted avg + LOO + trend damping + back-test + cloud-gated penalty #}
{% set raw = value if value is defined else state_attr('sensor.pv_remaining_states', 'json') %}

{% if raw and raw != '[]' and raw is not none %}
  {% set data = raw | from_json %}

  {# --- 0. NIGHT-CHECK --- #}
  {% set offset_min = (now().utcoffset().total_seconds() / 60) | int %}
  {% set pv_end_utc = data[0].pv_end | default('17:30') %}
  {% set end_min_local = ((pv_end_utc.split(':')[0] | int) * 60 + (pv_end_utc.split(':')[1] | int) + offset_min) % 1440 %}
  {% if (now().hour * 60 + now().minute) > end_min_local %}
    0.0
  {% else %}

    {# --- 1. BASE DATA --- #}
    {% set f_avg = data[0].f_avg_today_remaining | float(default=50.0) %}
    {% set current_month = now().month %}
    {% set snow_factor_today = 1.0 %}

    {# --- 2. SEASONAL SNOW DETECTION (Dec/Jan/Feb) --- #}
    {% if current_month in [12, 1, 2] %}
      {% set yesterday_date = (now() - timedelta(days=1)).strftime('%Y-%m-%d') %}
      {% set yesterday_data = data | selectattr('date', 'equalto', yesterday_date) | list | first %}
      {% if yesterday_data is defined %}
        {% set yesterday_perf = yesterday_data.yield_day_remaining | float(0) / ([105 - yesterday_data.h_avg_remaining | float(0), 5] | max) %}
        {% if yesterday_perf < 0.02 %}{% set snow_factor_today = 0.1 %}{% endif %}
      {% endif %}
    {% endif %}

    {# --- 3. ASTRONOMICAL BASE DATA --- #}
    {% set doy = now().strftime('%j') | int(default=1) %}
    {% set latitude = latitude if latitude is defined else state_attr('zone.home', 'latitude') | float(48.0) %}
    {% set lat_rad = latitude * pi / 180 %}
    {% set decl = -0.4093 * cos(2 * pi * (doy + 10) / 365) %}
    {% set dl_today = 24 / pi * acos([[(-tan(lat_rad) * tan(decl)), -1.0] | max, 1.0] | min) %}
    {% set sun_today = 0.80 + 0.20 * cos((doy - 172) * 2 * pi / 365) %}

    {# --- 4. BUILD DATA POOL (dynamic UV weight, Recency-Bonus, Top 15) --- #}
    {% set f_uv_avg = data[0].uv_avg_today_remaining | float(default=0.0) %}
    {# uv_w scales with forecast cloud: 0% clouds → 30%, 100% clouds → 70% #}
    {% set uv_w = [0.3 + 0.4 * (f_avg / 100.0), 0.7] | min %}
    {% set ns_pool = namespace(items=[], total_w=0) %}
    {% for item in data %}
      {% set yield_raw = item.yield_day_remaining | float(default=0) %}
      {% set clouds = item.h_avg_remaining | float(default=0) %}
      {% set uv_hist = item.uv_avg_remaining | float(default=0) %}
      {% set dt_item = as_datetime(item.date) %}
      {% if dt_item is not none %}
        {% set item_day = dt_item.strftime('%j') | int(default=1) %}
        {% set decl_i = -0.4093 * cos(2 * pi * (item_day + 10) / 365) %}
        {% set dl_item = 24 / pi * acos([[(-tan(lat_rad) * tan(decl_i)), -1.0] | max, 1.0] | min) %}
        {% set sun_item = 0.80 + 0.20 * cos((item_day - 172) * 2 * pi / 365) %}
        {% set s_korr = (sun_today / sun_item) * (dl_today / dl_item) %}
        {% set y_korr = yield_raw * s_korr %}
        {% set diff_c = (clouds - f_avg) | abs %}
        {% if f_uv_avg > 0 %}
          {% set diff = diff_c * (1.0 - uv_w) + (uv_hist - f_uv_avg) | abs * 8.0 * uv_w %}
        {% else %}
          {% set diff = diff_c %}
        {% endif %}
        {% set days_ago = ((now().timestamp() - dt_item.timestamp()) / 86400) | int(0) %}
        {% set w = (1 / ([diff, 0.5] | max)) * (1.0 + 0.3 * ([1.0 - days_ago / 30.0, 0.0] | max)) %}
        {% if yield_raw > 0.05 or clouds > 95 or current_month in [12, 1, 2] %}
          {% set ns_pool.total_w = ns_pool.total_w + w %}
          {% set ns_pool.items = ns_pool.items + [{'date': item.date, 'h_avg': clouds, 'y_korr': y_korr, 'w': w, 'days_ago': days_ago}] %}
        {% endif %}
      {% endif %}
    {% endfor %}

    {# --- 5. FORECAST CALCULATION (Top 15, decision logic) --- #}
    {% set top15 = (ns_pool.items | sort(attribute='w', reverse=True))[:15] %}
    {% set ns_top = namespace(total_w=0) %}
    {% for item in top15 %}{% set ns_top.total_w = ns_top.total_w + item.w %}{% endfor %}
    {% set pool = top15 %}
    {% set brighter = pool | selectattr('h_avg', 'le', f_avg) | list %}
    {% set darker = pool | selectattr('h_avg', 'ge', f_avg) | list %}
    {% set res = 0 %}
    {% if brighter | count > 0 and darker | count == 0 %}
      {% set worst_day = brighter | sort(attribute='y_korr') | first %}
      {% set res = worst_day.y_korr * ([120 - f_avg, 5.0] | max / [120 - worst_day.h_avg, 5.0] | max) %}
    {% elif darker | count > 0 and pool | selectattr('h_avg', 'le', f_avg) | list | count == 0 %}
      {% set res = darker | map(attribute='y_korr') | max %}
    {% elif pool | count > 0 %}
      {% set ns_mix = namespace(ws=0) %}
      {% for item in pool %}{% set ns_mix.ws = ns_mix.ws + (item.y_korr * item.w) %}{% endfor %}
      {% set res = ns_mix.ws / (ns_top.total_w if ns_top.total_w > 0 else 1) %}
    {% endif %}

    {# --- 6. LOO CROSS-VALIDATION: down-weight outlier pool days --- #}
    {% set ns_cv = namespace(items=[]) %}
    {% for item_i in pool %}
      {% set ns_loo = namespace(w=0, wy=0) %}
      {% for item_j in pool %}
        {% if item_j.date != item_i.date %}
          {% set ns_loo.w  = ns_loo.w  + item_j.w %}
          {% set ns_loo.wy = ns_loo.wy + item_j.w * item_j.y_korr %}
        {% endif %}
      {% endfor %}
      {% set acc = ((item_i.y_korr / (ns_loo.wy / ns_loo.w)) * 100) | round(0) | int if (ns_loo.w > 0 and ns_loo.wy > 0) else 100 %}
      {% set ns_cv.items = ns_cv.items + [{'date': item_i.date, 'acc': acc}] %}
    {% endfor %}
    {% if pool | count > 1 %}
      {% set ns_corr = namespace(w=0, wy=0) %}
      {% for item_i in pool %}
        {% set cv = ns_cv.items | selectattr('date', 'equalto', item_i.date) | list %}
        {% set acc_factor = 1.0 / (1.0 + ((cv[0].acc - 100) | abs) / 100.0) if cv | length > 0 else 1.0 %}
        {% set ns_corr.w  = ns_corr.w  + item_i.w * acc_factor %}
        {% set ns_corr.wy = ns_corr.wy + item_i.y_korr * item_i.w * acc_factor %}
      {% endfor %}
      {% if ns_corr.w > 0 and ns_corr.wy > 0 %}{% set res = ns_corr.wy / ns_corr.w %}{% endif %}
    {% endif %}

    {# --- 7. TREND DAMPING: recent ≤14d avg >15% above older → dampen 50% of excess --- #}
    {% set ns_rec = namespace(w=0, wy=0) %}
    {% set ns_old = namespace(w=0, wy=0) %}
    {% for item_i in pool %}
      {% if item_i.days_ago <= 14 %}
        {% set ns_rec.w = ns_rec.w + item_i.w %}{% set ns_rec.wy = ns_rec.wy + item_i.y_korr * item_i.w %}
      {% else %}
        {% set ns_old.w = ns_old.w + item_i.w %}{% set ns_old.wy = ns_old.wy + item_i.y_korr * item_i.w %}
      {% endif %}
    {% endfor %}
    {% if ns_rec.w > 0 and ns_old.w > 0 %}
      {% set avg_rec = ns_rec.wy / ns_rec.w %}
      {% set avg_old = ns_old.wy / ns_old.w %}
      {% if avg_old > 0 and (avg_rec / avg_old) > 1.15 %}
        {% set res = res / (1.0 + 0.5 * ((avg_rec / avg_old) - 1.0)) %}
      {% endif %}
    {% endif %}

    {# --- 8. BACK-TEST: data-driven carry-through from consecutive shortfall pairs --- #}
    {% set ns_all = namespace(sum_y=0.0, count_y=0) %}
    {% for item in pool %}{% if item.y_korr > 0 %}{% set ns_all.sum_y = ns_all.sum_y + item.y_korr %}{% set ns_all.count_y = ns_all.count_y + 1 %}{% endif %}{% endfor %}
    {% set mean_y = ns_all.sum_y / ([ns_all.count_y, 1] | max) %}
    {% set ns_bt = namespace(total=0, useful=0, trigger_sum=0.0, carry_sum=0.0) %}
    {% for item_i in pool %}
      {% if item_i.y_korr >= 0.40 * mean_y and item_i.y_korr < 0.85 * mean_y %}
        {% set next_items = pool | selectattr('date', 'equalto', (as_datetime(item_i.date) + timedelta(days=1)).strftime('%Y-%m-%d')) | list %}
        {% if next_items | length > 0 %}
          {% set ns_bt.total = ns_bt.total + 1 %}
          {% set ns_bt.trigger_sum = ns_bt.trigger_sum + (1.0 - item_i.y_korr / mean_y) %}
          {% set ns_bt.carry_sum = ns_bt.carry_sum + ([1.0 - next_items[0].y_korr / mean_y, 0.0] | max) %}
          {% if next_items[0].y_korr < mean_y %}{% set ns_bt.useful = ns_bt.useful + 1 %}{% endif %}
        {% endif %}
      {% endif %}
    {% endfor %}
    {% set effective_carry = (ns_bt.carry_sum / ns_bt.trigger_sum) * (ns_bt.useful / ns_bt.total) if (ns_bt.total > 0 and ns_bt.trigger_sum > 0) else 0.3 %}

    {# --- 9. CLOUD-GATED YESTERDAY PENALTY (both days ≥60% cloudy) --- #}
    {% set yesterday_date_yp = (now() - timedelta(days=1)).strftime('%Y-%m-%d') %}
    {% set yest_cv = ns_cv.items | selectattr('date', 'equalto', yesterday_date_yp) | list %}
    {% set yest_item = pool | selectattr('date', 'equalto', yesterday_date_yp) | list %}
    {% set yest_clouds = yest_item[0].h_avg if yest_item | length > 0 else 0 %}
    {% if yest_cv | length > 0 %}
      {% set yest_acc = yest_cv[0].acc %}
      {% if yest_acc >= 40 and yest_acc < 85 and f_avg >= 60 and yest_clouds >= 60 %}
        {% set res = res * ([1.0 - effective_carry * (1.0 - yest_acc / 100.0), 0.5] | max) %}
      {% endif %}
    {% endif %}

    {# --- 10. FINAL SCALING --- #}
    {{ (res * snow_factor_today) | round(2) }}

  {% endif %}
{% else %}
  0.0
{% endif %}
Explanation of the 10 steps:
- 0. night check: after local sunset to midnight, 0.0 is output; from midnight to sunrise, SQL provides all-day data.
- 1-3. basic data / snow / astronomy: month, snow factor (Dec-Feb), day length and relative position of the sun are calculated.
- 4. pool structure with dynamic UV weight:
uv_w = min(0.3 + 0.4 × cloud cover/100, 0.7)- with 0 % cloud cover, UV counts for 30 %, with 100 % for 70 %. Recency bonus up to +30 % for days <30 days. - 5. decision logic (top 15): Weighted average (normal case), Light reduction (today brighter than all reference days), Max assumption (today darker than all reference days).
- 6. LOO cross-validation: Each pool day is validated against the consensus of the others. Outliers are weighted down with
acc_factor = 1 / (1 + |acc-100| / 100). - 7. trend attenuation: If the most recent 14 days are more than 15 % above the older pool average, half of the excess is deducted.
- 8. back-test: A data-based carry-through factor is derived from consecutive moderate low-yield pairs in the pool.
- 9. cloud-gated penalty: Only if yesterday and today ≥60 % cloud cover, and yesterday's LOO-Acc was in the range 40-84 %, the carry-through factor is applied to the forecast.
- 10. scaling: multiplication with snow factor, output in kWh.
Markdown-Lovelace-Card (debugging table)
This Lovelace markdown card shows all top 15 comparison days with cloud cover, UV index and weighting - ideal for understanding the forecast calculation:
{% set raw_json = state_attr('sensor.pv_remaining_states', 'json') %}
{% if raw_json and raw_json != '[]' and raw_json is not none %}
  {% set data = raw_json | from_json %}

  {% if data | length > 0 %}
    {% set f_avg = data[0].f_avg_today_remaining | float(default=50.0) %}
    {% set f_uv_avg = data[0].uv_avg_today_remaining | float(default=0.0) %}

    {# 0. NIGHT-CHECK #}
    {% set offset_min = (now().utcoffset().total_seconds() / 60) | int %}
    {% set pv_end_utc = data[0].pv_end | default('17:30') %}
    {% set end_min_local = ((pv_end_utc.split(':')[0] | int) * 60 + (pv_end_utc.split(':')[1] | int) + offset_min) % 1440 %}
    {% set is_night = (now().hour * 60 + now().minute) > end_min_local %}

    {# 1. SEASONAL SNOW DETECTION (Dec / Jan / Feb) #}
    {% set current_month = now().month %}
    {% set snow_factor_today = 1.0 %}
    {% if current_month in [12, 1, 2] %}
      {% set yesterday_date = (now() - timedelta(days=1)).strftime('%Y-%m-%d') %}
      {% set yesterday_data = data | selectattr('date', 'equalto', yesterday_date) | list | first %}
      {% if yesterday_data is defined %}
        {% set yesterday_perf = yesterday_data.yield_day_remaining | float(0) / ([105 - yesterday_data.h_avg_remaining | float(0), 5] | max) %}
        {% if yesterday_perf < 0.02 %}{% set snow_factor_today = 0.1 %}{% endif %}
      {% endif %}
    {% endif %}

    {# 2. ASTRONOMICAL BASE DATA #}
    {% set latitude = state_attr('zone.home', 'latitude') | float(48.0) %}
    {% set doy = now().strftime('%j') | int(default=1) %}
    {% set lat_rad = latitude * pi / 180 %}
    {% set decl = -0.4093 * cos(2 * pi * (doy + 10) / 365) %}
    {% set dl_today = 24 / pi * acos([[(-tan(lat_rad) * tan(decl)), -1.0] | max, 1.0] | min) %}
    {% set sun_today = 0.80 + 0.20 * cos((doy - 172) * 2 * pi / 365) %}

    {# 3. POOL (dynamic UV weight, Recency-Bonus, Top 15) #}
    {% set uv_w = [0.3 + 0.4 * (f_avg / 100.0), 0.7] | min %}
    {% set ns_pool = namespace(items=[], total_w=0) %}
    {% for item in data %}
      {% set yield_raw = item.yield_day_remaining | float(default=0) %}
      {% set clouds = item.h_avg_remaining | float(default=0) %}
      {% set clouds_total = item.h_avg_total | float(default=0) %}
      {% set uv = item.uv_avg_remaining | float(default=0) %}
      {% set item_dt = as_datetime(item.date) %}
      {% if item_dt is not none %}
        {% set item_day = item_dt.strftime('%j') | int(default=1) %}
        {% set decl_i = -0.4093 * cos(2 * pi * (item_day + 10) / 365) %}
        {% set dl_item = 24 / pi * acos([[(-tan(lat_rad) * tan(decl_i)), -1.0] | max, 1.0] | min) %}
        {% set sun_item = 0.80 + 0.20 * cos((item_day - 172) * 2 * pi / 365) %}
        {% set s_korr = (sun_today / sun_item) * (dl_today / dl_item) %}
        {% set diff_c = (clouds - f_avg) | abs %}
        {% if f_uv_avg > 0 %}
          {% set diff = diff_c * (1.0 - uv_w) + (uv - f_uv_avg) | abs * 8.0 * uv_w %}
        {% else %}
          {% set diff = diff_c %}
        {% endif %}
        {% set days_ago = ((now().timestamp() - item_dt.timestamp()) / 86400) | int(0) %}
        {% set w = (1 / ([diff, 0.5] | max)) * (1.0 + 0.3 * ([1.0 - days_ago / 30.0, 0.0] | max)) %}
        {% if yield_raw > 0.05 or clouds > 95 or current_month in [12, 1, 2] %}
          {% set ns_pool.total_w = ns_pool.total_w + w %}
          {% set ns_pool.items = ns_pool.items + [{'date': item.date, 'h_avg': clouds, 'h_avg_total': clouds_total, 'uv_avg': uv, 'y_korr': yield_raw * s_korr, 's_fakt': s_korr, 'w': w, 'yield_day_total': item.yield_day_total, 'days_ago': days_ago, 'filtered': false}] %}
        {% else %}
          {% set ns_pool.items = ns_pool.items + [{'date': item.date, 'h_avg': clouds, 'h_avg_total': clouds_total, 'uv_avg': uv, 'y_korr': yield_raw * s_korr, 's_fakt': s_korr, 'w': 0, 'yield_day_total': item.yield_day_total, 'days_ago': days_ago, 'filtered': true}] %}
        {% endif %}
      {% endif %}
    {% endfor %}

    {# Top 15 selection #}
    {% set top15 = (ns_pool.items | sort(attribute='w', reverse=True))[:15] %}
    {% set ns_top = namespace(total_w=0) %}
    {% for item in top15 %}{% if not item.filtered %}{% set ns_top.total_w = ns_top.total_w + item.w %}{% endif %}{% endfor %}
    {% set pool = top15 | selectattr('filtered', 'equalto', false) | list %}

    {# 4. Decision logic #}
    {% set brighter = pool | selectattr('h_avg', 'le', f_avg) | list %}
    {% set darker = pool | selectattr('h_avg', 'ge', f_avg) | list %}
    {% set res = 0 %}
    {% set method = "No data" %}
    {% if brighter | count > 0 and darker | count == 0 %}
      {% set method = "Light reduction" %}
      {% set worst_day = brighter | sort(attribute='y_korr') | first %}
      {% set res = worst_day.y_korr * ([120 - f_avg, 5.0] | max / [120 - worst_day.h_avg, 5.0] | max) %}
    {% elif darker | count > 0 and pool | selectattr('h_avg', 'le', f_avg) | list | count == 0 %}
      {% set method = "Max assumption" %}
      {% set res = darker | map(attribute='y_korr') | max %}
    {% elif pool | count > 0 %}
      {% set method = "Weighted average" %}
      {% set ns_mix = namespace(ws=0) %}
      {% for item in pool %}{% set ns_mix.ws = ns_mix.ws + (item.y_korr * item.w) %}{% endfor %}
      {% set res = ns_mix.ws / (ns_top.total_w if ns_top.total_w > 0 else 1) %}
    {% endif %}

    {# 5. LOO cross-validation #}
    {% set ns_cv = namespace(items=[]) %}
    {% for item_i in pool %}
      {% set ns_loo = namespace(w=0, wy=0) %}
      {% for item_j in pool %}
        {% if item_j.date != item_i.date %}
          {% set ns_loo.w = ns_loo.w + item_j.w %}{% set ns_loo.wy = ns_loo.wy + item_j.w * item_j.y_korr %}
        {% endif %}
      {% endfor %}
      {% set acc = ((item_i.y_korr / (ns_loo.wy / ns_loo.w)) * 100) | round(0) | int if (ns_loo.w > 0 and ns_loo.wy > 0) else 100 %}
      {% set ns_cv.items = ns_cv.items + [{'date': item_i.date, 'acc': acc}] %}
    {% endfor %}
    {% if pool | count > 1 %}
      {% set ns_corr = namespace(w=0, wy=0) %}
      {% for item_i in pool %}
        {% set cv = ns_cv.items | selectattr('date', 'equalto', item_i.date) | list %}
        {% set acc_factor = 1.0 / (1.0 + ((cv[0].acc - 100) | abs) / 100.0) if cv | length > 0 else 1.0 %}
        {% set ns_corr.w = ns_corr.w + item_i.w * acc_factor %}{% set ns_corr.wy = ns_corr.wy + item_i.y_korr * item_i.w * acc_factor %}
      {% endfor %}
      {% if ns_corr.w > 0 and ns_corr.wy > 0 %}{% set res = ns_corr.wy / ns_corr.w %}{% endif %}
    {% endif %}

    {# 6. Trend damping #}
    {% set ns_rec = namespace(w=0, wy=0) %}{% set ns_old = namespace(w=0, wy=0) %}
    {% for item_i in pool %}
      {% if item_i.days_ago <= 14 %}{% set ns_rec.w = ns_rec.w + item_i.w %}{% set ns_rec.wy = ns_rec.wy + item_i.y_korr * item_i.w %}
      {% else %}{% set ns_old.w = ns_old.w + item_i.w %}{% set ns_old.wy = ns_old.wy + item_i.y_korr * item_i.w %}{% endif %}
    {% endfor %}
    {% set trend_damped = false %}
    {% if ns_rec.w > 0 and ns_old.w > 0 %}
      {% set avg_rec = ns_rec.wy / ns_rec.w %}{% set avg_old = ns_old.wy / ns_old.w %}
      {% if avg_old > 0 and (avg_rec / avg_old) > 1.15 %}
        {% set res = res / (1.0 + 0.5 * ((avg_rec / avg_old) - 1.0)) %}{% set trend_damped = true %}
      {% endif %}
    {% endif %}

    {# 7. Back-test + Cloud-gated penalty #}
    {% set ns_all = namespace(sum_y=0.0, count_y=0) %}
    {% for item in pool %}{% if item.y_korr > 0 %}{% set ns_all.sum_y = ns_all.sum_y + item.y_korr %}{% set ns_all.count_y = ns_all.count_y + 1 %}{% endif %}{% endfor %}
    {% set mean_y = ns_all.sum_y / ([ns_all.count_y, 1] | max) %}
    {% set ns_bt = namespace(total=0, useful=0, trigger_sum=0.0, carry_sum=0.0) %}
    {% for item_i in pool %}
      {% if item_i.y_korr >= 0.40 * mean_y and item_i.y_korr < 0.85 * mean_y %}
        {% set next_items = pool | selectattr('date', 'equalto', (as_datetime(item_i.date) + timedelta(days=1)).strftime('%Y-%m-%d')) | list %}
        {% if next_items | length > 0 %}
          {% set ns_bt.total = ns_bt.total + 1 %}{% set ns_bt.trigger_sum = ns_bt.trigger_sum + (1.0 - item_i.y_korr / mean_y) %}
          {% set ns_bt.carry_sum = ns_bt.carry_sum + ([1.0 - next_items[0].y_korr / mean_y, 0.0] | max) %}
          {% if next_items[0].y_korr < mean_y %}{% set ns_bt.useful = ns_bt.useful + 1 %}{% endif %}
        {% endif %}
      {% endif %}
    {% endfor %}
    {% set effective_carry = (ns_bt.carry_sum / ns_bt.trigger_sum) * (ns_bt.useful / ns_bt.total) if (ns_bt.total > 0 and ns_bt.trigger_sum > 0) else 0.3 %}
    {% set yest_date = (now() - timedelta(days=1)).strftime('%Y-%m-%d') %}
    {% set yest_cv = ns_cv.items | selectattr('date', 'equalto', yest_date) | list %}
    {% set yest_item = pool | selectattr('date', 'equalto', yest_date) | list %}
    {% set yest_clouds = yest_item[0].h_avg if yest_item | length > 0 else 0 %}
    {% set penalty_applied = false %}
    {% if yest_cv | length > 0 %}
      {% set yest_acc = yest_cv[0].acc %}
      {% if yest_acc >= 40 and yest_acc < 85 and f_avg >= 60 and yest_clouds >= 60 %}
        {% set res = res * ([1.0 - effective_carry * (1.0 - yest_acc / 100.0), 0.5] | max) %}
        {% set penalty_applied = true %}
      {% endif %}
    {% endif %}

    {% set final_val = res * snow_factor_today %}

**Forecast:**
## {{ (0.0 if is_night else final_val | round(2)) }} kWh
*Basis: **{{ f_avg }}%** clouds · **{{ f_uv_avg | round(1) }}** UV · uv_w={{ (uv_w * 100) | round(0) | int }}% | **{{ method }}***
{% if snow_factor_today < 1.0 %}⚠️ **Schnee erkannt! (Faktor {{ (snow_factor_today * 100) | round(0) }}%)**{% endif %}
{% if trend_damped %}📉 Trend-Dämpfung aktiv{% endif %}
{% if penalty_applied %}☁️ Cloud-gated Penalty aktiv (carry={{ (effective_carry * 100) | round(0) | int }}%){% endif %}

| Datum | Tag-Bew. | Tag-Ertrag | Rest-Bew. | UV | Rest-Ertrag | LOO-Acc | Gewicht |
| :--- | :---: | :---: | :---: | :---: | :---: | :---: | :---: |
{%- for item in top15 %}
  {%- set cv = ns_cv.items | selectattr('date', 'equalto', item.date) | list %}
  {%- set acc_str = cv[0].acc | string + "%" if cv | length > 0 else "–" %}
| {{ item.date }} | {{ item.h_avg_total }}% | {{ item.yield_day_total }} | **{{ item.h_avg }}%** | {{ item.uv_avg | round(1) }} | **{{ (item.y_korr * snow_factor_today) | round(2) }} ({{ item.s_fakt | round(2) }}×)**{% if item.filtered %}❌{% endif %} | {{ acc_str }} | {{ (((item.w / ns_top.total_w) * 100) if ns_top.total_w > 0 else 0) | round(1) }}% |
{%- endfor %}

  {% else %}
**Keine Daten im SQL-Ergebnis.**
  {% endif %}
{% else %}
**Warte auf SQL-Daten...**
{% endif %}
Morning sensor
Forecast for tomorrow: Helper - Template Sensor (UV-weighted, Top-15, Recency-Bonus):
{# PV FORECAST TOMORROW: weighted avg + LOO + trend damping + back-test + cloud-gated penalty #}
{% set raw_json = state_attr('sensor.pv_remaining_states', 'json') %}

{% if raw_json and raw_json != '[]' and raw_json is not none %}
  {% set data = raw_json | from_json %}

  {% set f_avg_tomorrow = data[0].f_avg_tomorrow | float(default=50.0) %}
  {% set f_uv_avg_tomorrow = data[0].uv_avg_tomorrow | float(default=0.0) %}

  {# ASTRONOMICAL BASE DATA FOR TOMORROW #}
  {% set latitude = latitude if latitude is defined else state_attr('zone.home', 'latitude') | float(48.0) %}
  {% set doy_tomorrow = (now() + timedelta(days=1)).strftime('%j') | int %}
  {% set lat_rad = latitude * pi / 180 %}
  {% set decl_tomorrow = -0.4093 * cos(2 * pi * (doy_tomorrow + 10) / 365) %}
  {% set dl_tomorrow = 24 / pi * acos([[(-tan(lat_rad) * tan(decl_tomorrow)), -1.0] | max, 1.0] | min) %}
  {% set sun_tomorrow = 0.80 + 0.20 * cos((doy_tomorrow - 172) * 2 * pi / 365) %}

  {# POOL: dynamic UV weight, Recency-Bonus, Top 15 #}
  {% set uv_w = [0.3 + 0.4 * (f_avg_tomorrow / 100.0), 0.7] | min %}
  {% set ns_pool = namespace(items=[], total_w=0) %}
  {% for item in data %}
    {% set yield_total = item.yield_day_total | float(default=0) %}
    {% set clouds_hist = item.h_avg_total | float(default=0) %}
    {% set uv_hist = item.uv_avg_total | float(default=0) %}
    {% set dt_item = as_datetime(item.date) %}
    {% if dt_item is not none %}
      {% set item_day = dt_item.strftime('%j') | int(default=1) %}
      {% set decl_i = -0.4093 * cos(2 * pi * (item_day + 10) / 365) %}
      {% set dl_item = 24 / pi * acos([[(-tan(lat_rad) * tan(decl_i)), -1.0] | max, 1.0] | min) %}
      {% set sun_item = 0.80 + 0.20 * cos((item_day - 172) * 2 * pi / 365) %}
      {% set s_korr = (sun_tomorrow / sun_item) * (dl_tomorrow / dl_item) %}
      {% set y_korr = yield_total * s_korr %}
      {% set diff_c = (clouds_hist - f_avg_tomorrow) | abs %}
      {% if f_uv_avg_tomorrow > 0 %}
        {% set diff = diff_c * (1.0 - uv_w) + (uv_hist - f_uv_avg_tomorrow) | abs * 8.0 * uv_w %}
      {% else %}
        {% set diff = diff_c %}
      {% endif %}
      {% set days_ago = ((now().timestamp() - dt_item.timestamp()) / 86400) | int(0) %}
      {% set w = (1 / ([diff, 0.5] | max)) * (1.0 + 0.3 * ([1.0 - days_ago / 30.0, 0.0] | max)) %}
      {% if yield_total > 0.05 %}
        {% set ns_pool.total_w = ns_pool.total_w + w %}
        {% set ns_pool.items = ns_pool.items + [{'date': item.date, 'h_avg': clouds_hist, 'w': w, 'y_korr': y_korr, 'days_ago': days_ago, 'filtered': false}] %}
      {% else %}
        {% set ns_pool.items = ns_pool.items + [{'date': item.date, 'h_avg': clouds_hist, 'w': 0, 'y_korr': y_korr, 'days_ago': days_ago, 'filtered': true}] %}
      {% endif %}
    {% endif %}
  {% endfor %}

  {% set top15 = (ns_pool.items | sort(attribute='w', reverse=True))[:15] %}
  {% set ns_top = namespace(total_w=0) %}
  {% for item in top15 %}{% if not item.filtered %}{% set ns_top.total_w = ns_top.total_w + item.w %}{% endif %}{% endfor %}
  {% set pool = top15 | selectattr('filtered', 'equalto', false) | list %}
  {% set brighter = pool | selectattr('h_avg', 'le', f_avg_tomorrow) | list %}
  {% set darker = pool | selectattr('h_avg', 'ge', f_avg_tomorrow) | list %}
  {% set res = 0 %}
  {% if brighter | count > 0 and darker | count == 0 %}
    {% set worst_day = brighter | sort(attribute='y_korr') | first %}
    {% set res = worst_day.y_korr * ([120 - f_avg_tomorrow, 5.0] | max / [120 - worst_day.h_avg, 5.0] | max) %}
  {% elif darker | count > 0 and pool | selectattr('h_avg', 'le', f_avg_tomorrow) | list | count == 0 %}
    {% set res = darker | map(attribute='y_korr') | max %}
  {% elif pool | count > 0 %}
    {% set ns_mix = namespace(ws=0) %}
    {% for item in pool %}{% set ns_mix.ws = ns_mix.ws + (item.y_korr * item.w) %}{% endfor %}
    {% set res = ns_mix.ws / (ns_top.total_w if ns_top.total_w > 0 else 1) %}
  {% endif %}

  {# LOO CROSS-VALIDATION #}
  {% set ns_cv = namespace(items=[]) %}
  {% for item_i in pool %}
    {% set ns_loo = namespace(w=0, wy=0) %}
    {% for item_j in pool %}
      {% if item_j.date != item_i.date %}{% set ns_loo.w = ns_loo.w + item_j.w %}{% set ns_loo.wy = ns_loo.wy + item_j.w * item_j.y_korr %}{% endif %}
    {% endfor %}
    {% set acc = ((item_i.y_korr / (ns_loo.wy / ns_loo.w)) * 100) | round(0) | int if (ns_loo.w > 0 and ns_loo.wy > 0) else 100 %}
    {% set ns_cv.items = ns_cv.items + [{'date': item_i.date, 'acc': acc}] %}
  {% endfor %}
  {% if pool | count > 1 %}
    {% set ns_corr = namespace(w=0, wy=0) %}
    {% for item_i in pool %}
      {% set cv = ns_cv.items | selectattr('date', 'equalto', item_i.date) | list %}
      {% set acc_factor = 1.0 / (1.0 + ((cv[0].acc - 100) | abs) / 100.0) if cv | length > 0 else 1.0 %}
      {% set ns_corr.w = ns_corr.w + item_i.w * acc_factor %}{% set ns_corr.wy = ns_corr.wy + item_i.y_korr * item_i.w * acc_factor %}
    {% endfor %}
    {% if ns_corr.w > 0 and ns_corr.wy > 0 %}{% set res = ns_corr.wy / ns_corr.w %}{% endif %}
  {% endif %}

  {# TREND DAMPING #}
  {% set ns_rec = namespace(w=0, wy=0) %}{% set ns_old = namespace(w=0, wy=0) %}
  {% for item_i in pool %}
    {% if item_i.days_ago <= 14 %}{% set ns_rec.w = ns_rec.w + item_i.w %}{% set ns_rec.wy = ns_rec.wy + item_i.y_korr * item_i.w %}
    {% else %}{% set ns_old.w = ns_old.w + item_i.w %}{% set ns_old.wy = ns_old.wy + item_i.y_korr * item_i.w %}{% endif %}
  {% endfor %}
  {% if ns_rec.w > 0 and ns_old.w > 0 %}
    {% set avg_rec = ns_rec.wy / ns_rec.w %}{% set avg_old = ns_old.wy / ns_old.w %}
    {% if avg_old > 0 and (avg_rec / avg_old) > 1.15 %}
      {% set res = res / (1.0 + 0.5 * ((avg_rec / avg_old) - 1.0)) %}
    {% endif %}
  {% endif %}

  {# BACK-TEST + CLOUD-GATED YESTERDAY PENALTY #}
  {% set ns_all = namespace(sum_y=0.0, count_y=0) %}
  {% for item in pool %}{% if item.y_korr > 0 %}{% set ns_all.sum_y = ns_all.sum_y + item.y_korr %}{% set ns_all.count_y = ns_all.count_y + 1 %}{% endif %}{% endfor %}
  {% set mean_y = ns_all.sum_y / ([ns_all.count_y, 1] | max) %}
  {% set ns_bt = namespace(total=0, useful=0, trigger_sum=0.0, carry_sum=0.0) %}
  {% for item_i in pool %}
    {% if item_i.y_korr >= 0.40 * mean_y and item_i.y_korr < 0.85 * mean_y %}
      {% set next_items = pool | selectattr('date', 'equalto', (as_datetime(item_i.date) + timedelta(days=1)).strftime('%Y-%m-%d')) | list %}
      {% if next_items | length > 0 %}
        {% set ns_bt.total = ns_bt.total + 1 %}{% set ns_bt.trigger_sum = ns_bt.trigger_sum + (1.0 - item_i.y_korr / mean_y) %}
        {% set ns_bt.carry_sum = ns_bt.carry_sum + ([1.0 - next_items[0].y_korr / mean_y, 0.0] | max) %}
        {% if next_items[0].y_korr < mean_y %}{% set ns_bt.useful = ns_bt.useful + 1 %}{% endif %}
      {% endif %}
    {% endif %}
  {% endfor %}
  {% set effective_carry = (ns_bt.carry_sum / ns_bt.trigger_sum) * (ns_bt.useful / ns_bt.total) if (ns_bt.total > 0 and ns_bt.trigger_sum > 0) else 0.3 %}
  {% set yesterday_date = (now() - timedelta(days=1)).strftime('%Y-%m-%d') %}
  {% set yest_cv = ns_cv.items | selectattr('date', 'equalto', yesterday_date) | list %}
  {% set yest_item = ns_pool.items | selectattr('date', 'equalto', yesterday_date) | selectattr('filtered', 'equalto', false) | list %}
  {% set yest_clouds = yest_item[0].h_avg if yest_item | length > 0 else 0 %}
  {% if yest_cv | length > 0 %}
    {% set yest_acc = yest_cv[0].acc %}
    {% if yest_acc >= 40 and yest_acc < 85 and f_avg_tomorrow >= 60 and yest_clouds >= 60 %}
      {% set res = res * ([1.0 - effective_carry * (1.0 - yest_acc / 100.0), 0.5] | max) %}
    {% endif %}
  {% endif %}

  {{ res | round(2) }}

{% else %}
  0.0
{% endif %}
Optimistic sensor (max)
Returns the highest corrected yield of the 5 most similar days - Upper limit of the forecast:
{% set raw_json = state_attr('sensor.pv_remaining_states', 'json') %}
{% if raw_json and raw_json != '[]' and raw_json is not none %}
  {% set data = raw_json | from_json %}
  {# Nacht-Check #}
  {% set offset_min = (now().utcoffset().total_seconds() / 60) | int %}
  {% set pv_end_utc = data[0].pv_end | default('17:30') %}
  {% set end_min_local = ((pv_end_utc.split(':')[0] | int) * 60 + (pv_end_utc.split(':')[1] | int) + offset_min) % 1440 %}
  {% if (now().hour * 60 + now().minute) > end_min_local %}
    0.0
  {% else %}
    {% set f_avg = data[0].f_avg_today_remaining | float(default=50.0) %}
    {% set f_uv_avg = data[0].uv_avg_today_remaining | float(default=0.0) %}
    {% set doy = now().strftime('%j') | int(default=1) %}
    {% set latitude = latitude if latitude is defined else state_attr('zone.home', 'latitude') | float(48.0) %}
    {% set lat_rad = latitude * pi / 180 %}
    {% set decl = -0.4093 * cos(2 * pi * (doy + 10) / 365) %}
    {% set dl_today = 24 / pi * acos([[(-tan(lat_rad) * tan(decl)), -1.0] | max, 1.0] | min) %}
    {% set sun_today = 0.80 + 0.20 * cos((doy - 172) * 2 * pi / 365) %}
    {% set uv_w = [0.3 + 0.4 * (f_avg / 100.0), 0.7] | min %}
    {% set ns_pool = namespace(items=[]) %}
    {% for item in data %}
      {% set dt_item = as_datetime(item.date) %}
      {% if dt_item is not none %}
        {% set item_day = dt_item.strftime('%j') | int(default=1) %}
        {% set decl_i = -0.4093 * cos(2 * pi * (item_day + 10) / 365) %}
        {% set dl_item = 24 / pi * acos([[(-tan(lat_rad) * tan(decl_i)), -1.0] | max, 1.0] | min) %}
        {% set sun_item = 0.80 + 0.20 * cos((item_day - 172) * 2 * pi / 365) %}
        {% set s_korr = (sun_today / sun_item) * (dl_today / dl_item) %}
        {% set yield_korr = item.yield_day_remaining | float(default=0) * s_korr %}
        {% set uv_hist = item.uv_avg_remaining | float(default=0) %}
        {% set diff_c = (item.h_avg_remaining | float(default=0) - f_avg) | abs %}
        {% if f_uv_avg > 0 %}
          {% set diff = diff_c * (1.0 - uv_w) + (uv_hist - f_uv_avg) | abs * 8.0 * uv_w %}
        {% else %}
          {% set diff = diff_c %}
        {% endif %}
        {% set ns_pool.items = ns_pool.items + [{'diff': diff, 'y_korr': yield_korr}] %}
      {% endif %}
    {% endfor %}
    {% set top15 = (ns_pool.items | sort(attribute='diff'))[:15] %}
    {% set max_yield = top15 | map(attribute='y_korr') | max if top15 | count > 0 else 0 %}
    {{ max_yield | round(2) }}
  {% endif %}
{% else %}
  0
{% endif %}
Pessimistic sensor (min)
Returns the lowest corrected yield of the 5 most similar days - Lower limit of the forecast:
{% set raw_json = state_attr('sensor.pv_remaining_states', 'json') %}
{% if raw_json and raw_json != '[]' and raw_json is not none %}
  {% set data = raw_json | from_json %}
  {# Nacht-Check #}
  {% set offset_min = (now().utcoffset().total_seconds() / 60) | int %}
  {% set pv_end_utc = data[0].pv_end | default('17:30') %}
  {% set end_min_local = ((pv_end_utc.split(':')[0] | int) * 60 + (pv_end_utc.split(':')[1] | int) + offset_min) % 1440 %}
  {% if (now().hour * 60 + now().minute) > end_min_local %}
    0.0
  {% else %}
    {% set f_avg = data[0].f_avg_today_remaining | float(default=50.0) %}
    {% set f_uv_avg = data[0].uv_avg_today_remaining | float(default=0.0) %}
    {% set current_month = now().month %}
    {% set doy = now().strftime('%j') | int(default=1) %}
    {% set latitude = latitude if latitude is defined else state_attr('zone.home', 'latitude') | float(48.0) %}
    {% set lat_rad = latitude * pi / 180 %}
    {% set decl = -0.4093 * cos(2 * pi * (doy + 10) / 365) %}
    {% set dl_today = 24 / pi * acos([[(-tan(lat_rad) * tan(decl)), -1.0] | max, 1.0] | min) %}
    {% set sun_today = 0.80 + 0.20 * cos((doy - 172) * 2 * pi / 365) %}
    {% set uv_w = [0.3 + 0.4 * (f_avg / 100.0), 0.7] | min %}
    {% set ns_pool = namespace(items=[]) %}
    {% for item in data %}
      {% set dt_item = as_datetime(item.date) %}
      {% if dt_item is not none %}
        {% set item_day = dt_item.strftime('%j') | int(default=1) %}
        {% set decl_i = -0.4093 * cos(2 * pi * (item_day + 10) / 365) %}
        {% set dl_item = 24 / pi * acos([[(-tan(lat_rad) * tan(decl_i)), -1.0] | max, 1.0] | min) %}
        {% set sun_item = 0.80 + 0.20 * cos((item_day - 172) * 2 * pi / 365) %}
        {% set s_korr = (sun_today / sun_item) * (dl_today / dl_item) %}
        {% set yield_korr = item.yield_day_remaining | float(default=0) * s_korr %}
        {% set uv_hist = item.uv_avg_remaining | float(default=0) %}
        {% set diff_c = (item.h_avg_remaining | float(default=0) - f_avg) | abs %}
        {% if f_uv_avg > 0 %}
          {% set diff = diff_c * (1.0 - uv_w) + (uv_hist - f_uv_avg) | abs * 8.0 * uv_w %}
        {% else %}
          {% set diff = diff_c %}
        {% endif %}
        {% set ns_pool.items = ns_pool.items + [{'diff': diff, 'h_avg': item.h_avg_remaining | float(0), 'y_korr': yield_korr}] %}
      {% endif %}
    {% endfor %}
    {% set top15 = (ns_pool.items | sort(attribute='diff'))[:15] %}
    {% set brighter = top15 | selectattr('h_avg', 'le', f_avg) | list %}
    {% set darker = top15 | selectattr('h_avg', 'gt', f_avg) | list %}
    {% set res = 0 %}
    {% if top15 | count > 0 %}
      {% if brighter | count > 0 and darker | count == 0 %}
        {% set worst = brighter | sort(attribute='y_korr') | first %}
        {% set res = worst.y_korr * ([120 - f_avg, 5.0] | max / [120 - worst.h_avg, 5.0] | max) %}
      {% elif darker | count > 0 and brighter | count == 0 %}
        {% set res = darker | map(attribute='y_korr') | min %}
      {% else %}
        {% set res = top15 | map(attribute='y_korr') | min %}
      {% endif %}
    {% endif %}
    {{ res | round(2) }}
  {% endif %}
{% else %}
  0
{% endif %}
The result
In progress
To achieve even better results, I am currently working on incorporating temperature and rainfall into the calculation. I am also testing an automatic optimization of the parameters using historical data.
Conclusion
PV History Forecast is the smart alternative to external forecasting services for anyone who uses Home Assistant and already has historical PV yield data. The integration learns from the past of your own system and thus provides a significantly more system-specific residual forecast - without an external API, without registration, directly from your own HA database.
 ({{pro_count}})
{{percentage}} % positive
 ({{con_count}})