Website stress test - measure performance - load time

In the past, there have always been sites that have collapsed under the load of high traffic. Although my site has been coping well with the current traffic to date, I was curious to see how many concurrent visitors my web server could handle, so I put it through a performance test.
Response time of the website
The response time of the website already provides an indication of how many requests the web server can handle:
How many requests / second are normal?
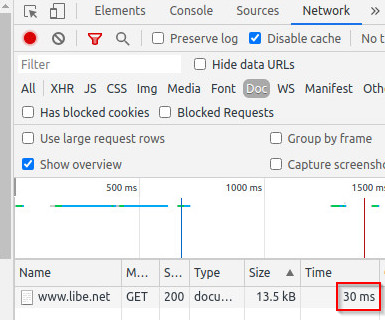
According to Google, the loading time of the main document of a web page should be under 200ms (source: developers.google.com/speed/docs/insights/mobile). A look into Chrome Devtools, F12 in the browser, reveals the page load time. The main document can be easily filtered with "Doc":

The higher this load time is, the more time the server needs to render the page server-side. The value of course includes the latency to the server, something between 20 and 70ms. If the server needs, let's say, 100ms to render the page, it will manage just under 10 requests / second. Of course, the server usually has several processors and thus several threads at the same time at the start and thus more computing power: But who has not rented a dedicated server, shares the hardware with others. Even a vServer or cloud server with 2v CPU then does not deliver much more in practice than if the requests were simply executed in sequence. This strong simplification is of course not permissible in this way, in practice we are nevertheless in this dimension for the majority with only one server ...
How can the page be accelerated?
Hardly anyone uses static web pages today, although pages without server logic would be really fast. The less the server has to calculate for compiling the page, or the less data the server has to fetch from possibly complicated queries from the database, the faster the page can be compiled and sent to the browser. So the goal is to minimize the computing time for the page. For this purpose, the web server and its configuration can be tuned. In addition, today's dynamic websites are usually accelerated by caching certain parts or the entire page. The page is calculated partially or completely at the first call and the result is stored separately. When the page is called up again, pre-calculated results are used to deliver the page. Larger websites mainly use multiple web servers to share the load, or a service such as Cloudflare can be used to cache the content.
Test speed: Tools
Warning: please use only for your own website
Please use the tools presented here only for your own website. The load tests could overload the website for the duration of the test until it might stop responding.
loader.io
Loader.io offers a website stress test as a cloud service. To prevent the service from being abused, the domain must be confirmed in advance via text file on the server, see also: https://loader.io/
Similar results are provided by the small http benchmarking tool wrt:
wrk - http benchmark
wrk - Download
For the installation a Linux based computer is required. With the following terminal commands wrk can be downloaded and prepared for use:
git clone https://github.com/wg/wrk.git
cd wrk
make
see also: https://github.com/wg/wrk
Test of the own web server: wrk
wrk can then be started simply via the terminal with the following parameters:
./wrk -t4 -c400 -d30s http://127.0.0.1:90Parameter
-t4 ... 4 threads
-c400 ... 400 simultaneous connections
-d30s ... Duration 30 seconds
http://127.0.0.1:90 is an example for the local web server when listening on port 90.
Result: dynamic page vs. static cache
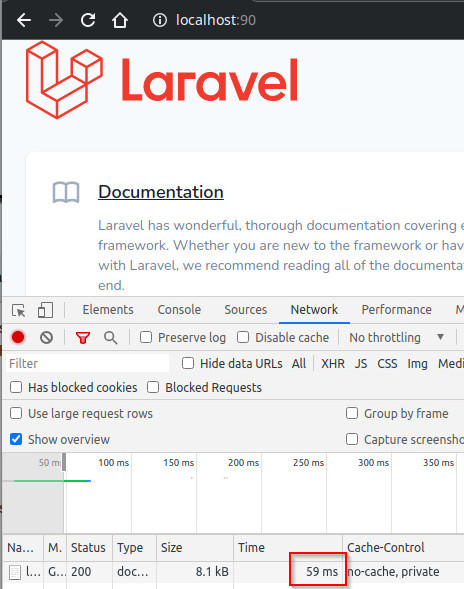
Testing a fresh Laravel installation and its home page looks like this:

The load time on my local machine is 59ms for loading the main document, which would mean about 17 pages per second per compute core. Since my computer has 4 cores and also the website is running on the same machine, the computer can handle more than twice as many requests: The result of wrk is 37.34 requests / second:
./wrk -t4 -c400 -d30s http://127.0.0.1:90
Running 30s test @ http://127.0.0.1:90
  4 threads and 400 connections
  Thread Stats   Avg      Stdev     Max   +/- Stdev
    Latency     1.32s   391.33ms   1.89s    64.29%
    Req/Sec    18.57     16.99   150.00     80.23%
  1124 requests in 30.10s, 20.43MB read
  Socket errors: connect 0, read 0, write 0, timeout 1096
Requests/sec:     37.34
Transfer/sec:    694.86KB
Cache with static .html files
As an example, Joseph Silber's Laravel package caches the web page into static .html files. The webserver: nginx only returns the content of the files after the first call, see: github.com/JosephSilber/page-cache
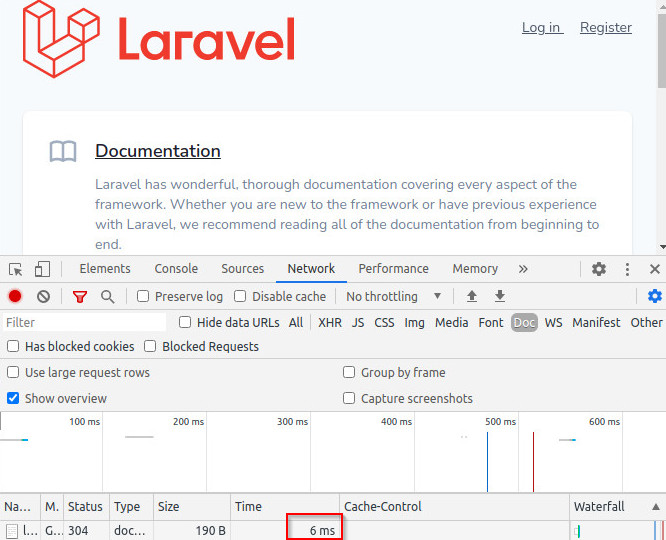
With this setup things look completely different:

The page can be passed to the browser in 6ms and wrk shows an unbelievable 4766.22 requests/sec for me:
./wrk -t4 -c400 -d30s http://127.0.0.1:90
Running 30s test @ http://127.0.0.1:90
  4 threads and 400 connections
  Thread Stats   Avg      Stdev     Max   +/- Stdev
    Latency    32.99ms   53.77ms   1.99s    94.57%
    Req/Sec     1.33k     1.04k    5.49k    71.34%
  143362 requests in 30.08s, 2.38GB read
  Socket errors: connect 0, read 0, write 0, timeout 1328
Requests/sec:   4766.22
Transfer/sec:     80.89MB
The value cannot be directly converted to the number of visitors, because a page request loads additional assets: Javascript, CSS and images, accordingly a user generates several requests. Since here the main document is provided as fast as the assets, the number and size of the assets also has a more important role than with a dynamic page: with a dynamic page the time for loading the main document is the bottleneck, with static files the number and size of the files.
Conclusion
The performance of a web page is extremely dependent on the web application used and the web server setup. Dynamic web pages or frameworks are indispensable today, but they have a certain overhead. The impact of this overhead can in turn be minimized by certain caching mechanisms. Besides caching, the web server can also play a certain role. The range of possible requests per second varies from a few requests per second to several thousand requests per second , depending on the web server and cache setup.
 ({{pro_count}})
{{percentage}} % positive
 ({{con_count}})