Grafana: Docker - visualize data and define alarms

Grafana is a web application for visualizing data. With Grafana you can create nice charts or define alarms in a few minutes.
Docker Basics
A container is an isolated environment independent of the operating system (OS):
When a container is first launched, Docker independently loads all the necessary sources
from the internet.
Docker can be installed on Windows, macOS or an Linux Distribution
Requirements
As a prerequisite for Grafana, a data source is needed, preferably a "Time series database", i.e. a database optimized for time data. An example of such a "Time series database" is InfluxDB, see: Influx DB - Time series database.
In order to be able to display data in Grafana, these must of course somehow end up in the database, for example via ioBroker, see: ioBroker Install - Docker or HomeAssistant, see Home-Assistant Docker Conbee 2 and Zigbee2MQTT / deCONZ
Grafana
As a prerequisite I use my own network, if this is already available from ioBroker, the following command is obsolete.
docker network create smart-homeFor the actual start of Grafana, I used the following command.
mkdir -p /docker
mkdir -p /docker/grafana
docker run -d \
-p 3000:3000  \
--network=smart-home \
--restart=always --name=grafana \
-v /docker/grafana:/var/lib/grafana grafana/grafana

After the first start "admin" is used as username and the password "admin".
Data source
As data source I use a previously created Influx container, see: Influx DB - Time series database


The information refers to an InfluxDB version 1. I have saved myself the switch to version 2 and have now implemented all data directly in Home Assistant and the visualizations relevant to me in it.
Home Assistant and transferring data to the Influx DB
Integrating the ioBroker values of the Influx-DB and creating diagrams (charts)
Details about the ioBroker setup, see: ioBroker Installieren - Docker


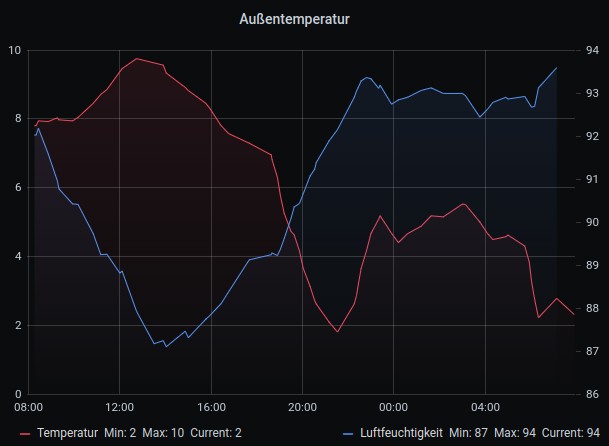
Panel with 2 different units

Swap home dashboard
To use any dashboard as a home page, the first thing to do is to bookmark it and then select it in the settings.


Grafana image renderer Docker
To be able to attach images for notification, Docker requires its own image renderer container, this can be started as follows:
docker run -d \
--name=renderer \
--restart=always \
-p=3001:8081 \
grafana/grafana-image-renderer
To make the existing Grafana container talk to the image renderer, I had to adjust the container accordingly:
The address 192.168.1.5 is the IP address of the host, this must be adapted accordingly:
docker stop grafana
docker rm grafana

docker run -d \
-p 3000:3000  \
--network=smart-home \
-e "GF_RENDERING_SERVER_URL=http://192.168.1.5:3001/render" \
-e "GF_RENDERING_CALLBACK_URL=http://192.168.1.5:3000/" \
-e "GF_SERVER_DOMAIN=192.168.1.5" \
--restart=always \
--name=grafana \
-v /docker/grafana:/var/lib/grafana grafana/grafana
InfluxDB Error: unsupported mean iterator type: *query.booleanInterruptIterator
One little thing was not quite self-explanatory for me at the beginning. When creating a chart with true/false values, "Select" must be changed to "last()", otherwise the following error is thrown: unsupported mean iterator type: *query.booleanInterruptIterator

Docker: Install plugins
Plugins can be installed via the Grafana CLI:
grafana-cli plugins install PluginNameWhen using the Docker container, we need to connect to the container beforehand using "docker exec":
bernhard@sox:~$ docker exec -it grafana /bin/bash
bash-5.0$ grafana-cli plugins install natel-discrete-panel
installing natel-discrete-panel @ 0.1.1
from: https://grafana.com/api/plugins/natel-discrete-panel/versions/0.1.1/download
into: /var/lib/grafana/plugins
Notification via Signal
Alternatively, the messenger Signal can also be used for notification, see: Send Signal messages via API: signal-cli-rest-api
Conclusion
At my first attempt to start Grafana, I was very surprised how fast, easy and self-explanatory data can be visualized with it. A prerequisite for using Grafana is of course a database, which is also done in a few minutes with Docker and InfluxDB. Then there is the actual data for the database, which comes, as already described, from Home Assistant.
 ({{pro_count}})
{{percentage}} % positive
 ({{con_count}})