HA - SQLite Insights: Database Layout / Example Queries
To be able to compile better SQL queries, I took a closer look at the Home-Assistant database schema. Initially mainly to correct certain historical data, later to improve the energy forecast of my PV system, which enables more efficient control of the heating. Details on the queries for the .
Direct queries or changes to the database can be made using SQL queries:
See also the different options for direct access to the database: 3 variants: SQLite database access - Home Assistant
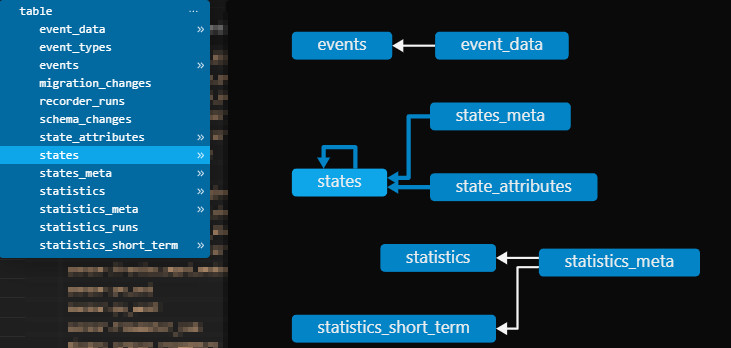
A look at SQLite3 Editor in VSCode shows the individual tables and their relationships.

The "states" table is interesting for current data within 10 days. The "statistics" table also provides older data: One value per hour.
| Table name | Purpose | |
|---|---|---|
| States (all current status information: up to 10 days) | states_meta | List of all entities: Unique identifier (entity_id), example sensor.temperature and the associated internal database ID in the form of a consecutive number (metadata_id). The table translates the metadata_id to the entity_id |
| states | All status information of all entities: Uses the id from states_meta. | |
| Statistics and LTS / long-term statistics | statistics_meta |
List of all entities with statistics data: id for entity_id (e.g. sensor.temperature). |
| statistics |
All LTS status information (one value per hour, stored for longer than 10 days). Uses the id from statistics_meta. If the sensor is not a continuous counter, but a counter of the measurement type (property: state_class=measurement), a maximum and minimum value is saved in addition to the average value. |
|
| statistiscs_short_term |
Status information of the last 10 days in 5-minute intervals. Uses the id from statistics_meta. If the sensor is not a continuous counter but a counter of the measurement type (property: state_class=measurement), a maximum and minimum value is saved in addition to the average value. |
States data (current values of all entities)
The unique identifiers (entity_id) of all entities are listed in the "states_meta" table:
| id | metadata_id | entity_id |
|---|---|---|
| 1 | 20 | sensor.pv_voltage_dc |
| 2 | 21 | sensor.pv_current_dc |
| 3 | 22 | sensor.pv_power_ac |
The actual values of the entities are stored in the"states" table, using the metadata_id:
| state_id | state | last_changed_ts | last_reported_ts | last_updated_ts | attributes_id | metadata_id |
| 1 | 800.00 | 1743775748.382725 | 1743775743.2130053 | 1743775743.2130053 | 1 | 20 |
| 2 | 810.00 | 1743775848.382725 | 1743775843.2130053 | 1743775843.2130053 | 2 | 20 |
| 3 | 799.10 | 1743775948.382725 | 1743775943.2130053 | 1743775943.2130053 | 3 | 20 |
The listed values in this example therefore all belong to "sensor.pv_voltage_dc", as the metadata_id "20" is used and this is translated to "sensor.pv_voltage_dc" in states_meta. The attributes_id refers to an additional entry in the "state_attributes" table. The data of the 3 tables can be summarized and output in a readable format using a customized SQL query:
Last hour, all status - data of all entities including entity_id and shared_attrs:
The following query lists all status information of all entities for the last hour:
SELECT STRFTIME('%Y.%m.%d %H:%M', datetime(last_updated_ts, 'unixepoch', 'localtime')) AS date,
    states_meta.entity_id,
    states.state,
    shared_attrs
FROM states
INNER JOIN states_meta ON states_meta.metadata_id = states.metadata_id
INNER JOIN state_attributes ON state_attributes.attributes_id = states.attributes_id
WHERE last_updated_ts BETWEEN strftime('%s', 'now', '-1 hour') AND strftime('%s', 'now')
Current status for a specific entity
SQL query:
select datetime(last_updated_ts, 'unixepoch', 'localtime') AS readabledate,state from states where metadata_id = ( SELECT metadata_id FROM states_meta
WHERE entity_id = 'sensor.flowmeter_sum')  order by last_updated_ts desc limit 10;
Output:
| readabledate | state |
|---|---|
| 2025-04-04 14:17:38 | 5812.24 |
| 2025-04-04 14:07:08 | 5812.23 |
| 2025-04-04 13:55:26 | 5812.22 |
Current status for a specific entity including shared_attrs
In addition to the current status (state), certain entities have additional properties, stored in an additional column: shared_attrs. The following query can be used to read an entity and its additional properties (shated_attrs):
SELECT STRFTIME('%Y.%m.%d %H:%M',datetime(last_updated_ts, 'unixepoch', 'localtime')) as readabledate,states_meta.entity_id,states.state,shared_attrs FROM states
INNER JOIN states_meta ON states_meta.metadata_id = states.metadata_id
INNER JOIN state_attributes ON state_attributes.attributes_id = states.attributes_id
WHERE states_meta.entity_id = 'sensor.fronius_storage_chast' order by last_updated_ts DESC limit 1
Output:
| readabledate | entity_id | state | shared_attrs |
|---|---|---|---|
| 2025.04.04 13:38 | sensor.fronius_storage_chast | FULL | {"integration": "sunspec", "suns... |
Status of a specific entity at a specific time, for example yesterday at the same time
SQL query
SELECT STRFTIME('%Y.%m.%d %H:%M',datetime(last_updated_ts, 'unixepoch', 'localtime')) as date,states_meta.entity_id,states.state,shared_attrs FROM states
INNER JOIN states_meta ON states_meta.metadata_id = states.metadata_id
INNER JOIN state_attributes ON state_attributes.attributes_id = states.attributes_id
WHERE states_meta.entity_id = 'sensor.fronius_storage_chast' and
last_updated_ts < (SELECT unixepoch(datetime('now'),'-1 days')) order by last_updated_ts DESC limit 1
Output:
| date | entity_id | state | shared_attrs |
|---|---|---|---|
| 2025.04.03 12:46 | sensor.fronius_storage_chast | FULL | {"integration": "sunspec", "suns... |
Entities with additional data in shared_attrs: e.g. weather data
The following query retrieves the last ten data records for the "weather.home" entity. Included are the formatted date, the entity ID, the state and common attributes from the shared_attrs table. The results were sorted by the last update time in the following SQL query:
SELECT STRFTIME('%Y.%m.%d %H:%M',datetime(last_updated_ts, 'unixepoch', 'localtime')) as readabledate,states_meta.entity_id,states.state,shared_attrs FROM states
INNER JOIN states_meta ON states_meta.metadata_id = states.metadata_id
INNER JOIN state_attributes ON state_attributes.attributes_id = states.attributes_id
WHERE states_meta.entity_id like '%weather.home' and
last_updated_ts < (SELECT unixepoch(datetime('now'),'-0 days')) order by last_updated_ts DESC limit 10
Output:
| readabledate | entity_id | state | shared_attrs |
|---|---|---|---|
| 2025.04.04 13:38 | weather.home | sunny | {"temperature":18.9, "dew_point":8.8, "temperature_unit":"°C", "humidity":52, "cloud_coverage":0.0, "uv_index":3.2, "pressure":1017.7, "pressure_unit": "hPa", "wind_bearing":61.7, "wind_speed":15.5, "wind_speed_unit": "km/h", "visibility_unit": "km", "precipitation_unit": "mm", "friendly_name": "Forecast Home"}... |
| 2025.04.04 13:27 | weather.home | sunny | {"temperature":18.9, "dew_point":8.8, "temperature_unit":"°C", "humidity":52, "cloud_coverage":0.0, "uv_index":3.2, "pressure":1017.7, "pressure_unit": "hPa", "wind_bearing":61.7, "wind_speed":15.5, "wind_speed_unit": "km/h", "visibility_unit": "km", "precipitation_unit": "mm", "friendly_name": "Forecast Home"}... |
| 2025.04.04 12:26 | weather.home | sunny | {"temperature":18.7, "dew_point":8.0, "temperature_unit":"°C", "humidity":50, "cloud_coverage":0.0, "uv_index":4.0, "pressure":1018.5, "pressure_unit": "hPa", "wind_bearing":63.1, "wind_speed":15.8, "wind_speed_unit": "km/h", "visibility_unit": "km", "precipitation_unit": "mm", "friendly_name": "Forecast Home"}... |
To display certain values from the shared_attrs column as separate columns, the JSON data can be extracted with the following SQL query:
SELECT STRFTIME('%Y.%m.%d %H:%M',datetime(last_updated_ts, 'unixepoch', 'localtime')) as readabledate,states_meta.entity_id,states.state,json_extract(shared_attrs, '$.temperature') AS temperature,json_extract(shared_attrs, '$.cloud_coverage') AS cloud_coverage, shared_attrs FROM states
INNER JOIN states_meta ON states_meta.metadata_id = states.metadata_id
INNER JOIN state_attributes ON state_attributes.attributes_id = states.attributes_id
WHERE states_meta.entity_id like '%weather.home' and
last_updated_ts < (SELECT unixepoch(datetime('now'),'-0 days')) order by last_updated_ts DESC limit 10
Output:
| readabledate | entity_id | state | temperature | cloud_coverage | shared_attrs |
|---|---|---|---|---|---|
| 2025.04.04 13:38 | weather.home | sunny | 18.9 | 0.0 | {"temperature":18.9, "dew_point":8.... |
| 2025.04.04 13:27 | weather.home | sunny | 18.9 | 0.0 | {"temperature":18.9, "dew_point":8.... |
| 2025.04.04 12:26 | weather.home | sunny | 18.7 | 0.0 | {"temperature":18.7, "dew_point":8.... |
Historical data: Values from the statistics tables
Like the status table, the statistics tables do not directly use the unique entity ID (e.g. sensor.temperature), but a meta table (statistics_meta) for the translation of the entity ID (column: statistic_id) to an id (number)
| id | statistic_id | source | unit_of_measurement | has_mean | has_sum | name | mean_type |
|---|---|---|---|---|---|---|---|
| 1 | sensor.openweathermap_temperature | recorder | °C | NULL |
False | NULL |
1 |
| 30 | sensor.displaykueche_power | recorder | W | NULL |
False | NULL |
1 |
| 88 | sensor.grid_consumption_energy | recorder | Wh | NULL |
True | NULL |
0 |
As an alternative to the status table (states), the values of a specific entity can be read from the "statistics" table using an SQL query. The metatdata_id is also translated here via a sub-query from the statistics_meta table:
Database Query:
select datetime(created_ts, 'unixepoch', 'localtime') AS readabledate, * from statistics WHERE metadata_id = ( SELECT id FROM statistics_meta WHERE statistic_id = 'sensor.flowmeter_sum') AND strftime('%Y%m%d',datetime(created_ts, 'unixepoch','localtime')) > strftime('%Y%m%d', datetime('now','localtime','-3 days'));Output:
| readabledate | id | mean | min | max | state | sum | metadata_id | created_ts | start_ts |
|---|---|---|---|---|---|---|---|---|---|
| 2025-04-03 00:00:10 | 6212270 | NULL |
NULL |
ZERO |
5795.28 | 18346.070000000367 | 606 | 1743638410.8686857 | 1743634800.0 |
| 2025-04-03 01:00:10 | 6212828 | ZERO |
ZERO |
NULL |
5795.34 | 18346.13000000037 | 606 | 1743642010.2952905 | 1743638400.0 |
| 2025-04-03 02:00:10 | 6213384 | ZERO |
ZERO |
NULL |
5795.39 | 18346.18000000037 | 606 | 1743645610.320077 | 1743642000.0 |
The statistics table has another special feature: Depending on the sensor type, different columns of the database table are used: Sensors of the type state_class=total or total_increasing store their values in the columns: "state" and "sum". A sensor of the type "state_class = measurement" uses the columns mean, min and max.
Here is an SQL query for a sensor of the type: "state_class = measurement":
select datetime(created_ts, 'unixepoch', 'localtime') AS readabledate,* from statistics WHERE metadata_id = ( SELECT id FROM statistics_meta WHERE statistic_id = 'sensor.eg_temperatur') AND strftime('%Y%m%d',datetime(created_ts, 'unixepoch','localtime')) > strftime('%Y%m%d', datetime('now','localtime','-3 days'));Output:
| readabledate | id | created | start | mean | min | max | state | sum | metadata_id | created_ts | start_ts |
|---|---|---|---|---|---|---|---|---|---|---|---|
| 2025-04-03 00:00:10 | 6212150 | NULL |
NULL |
23.0 | 23.0 | 23.0 | ZERO |
ZERO |
319 | 1743638410.8686857 | 1743634800.0 |
| 2025-04-03 01:00:10 | 6212708 | ZERO |
ZERO |
23.0 | 23.0 | 23.0 | ZERO |
ZERO |
319 | 1743642010.2952905 | 1743638400.0 |
| 2025-04-03 02:00:10 | 6213264 | ZERO |
ZERO |
23.0 | 23.0 |
23.0 |
ZERO |
ZERO |
319 | 1743645610.320077 | 1743642000.0 |
The "statistics" table saves hourly values without deleting them. The statistics_short_term table is different: it saves the values every 5 minutes and deletes the data after 10 days, just like the "states" table. The database layout of the statistics and statistics_short_term tables is identical. Both use the statistics_meta table and both fill state and sum or mean, min and max depending on the sensor type.
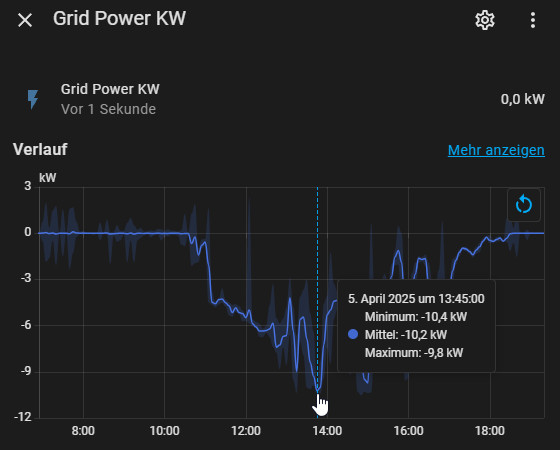
As an example, for the detailed view of a sensor for: Minimum, mean and maximum, the data from the "mean", "min" and "max" columns of the "statistics_short_term" table are used:

Conclusion
The Home Assistant database schema allows efficient evaluation of entity data through the use of tables for current and historical information. The "states" table provides access to current data, while "statistics" is used for long-term data with an hourly interval. Entities and their additional attributes can be evaluated individually and in a targeted manner using SQL queries.
 ({{pro_count}})
{{percentage}} % positive
 ({{con_count}})