Home Assistant Templates / Statistics and Sensors

With the help of Home-Assistant templates, data from various sensors can be converted, combined or provided with your own formulas. Templates allow the creation of logic blocks for use in custom sensors, conditions or for customizing specific values in Lovelace Cards. The syntax used is Jinja2, a fully functional template engine for Python.
Where can templates be used?
Templates can be used in the following Home Assistant components:
- Developer tools / TEMPLATE
- Template sensors (under Helpers)
- automations
- certain Lovelace Cards
Developer tools
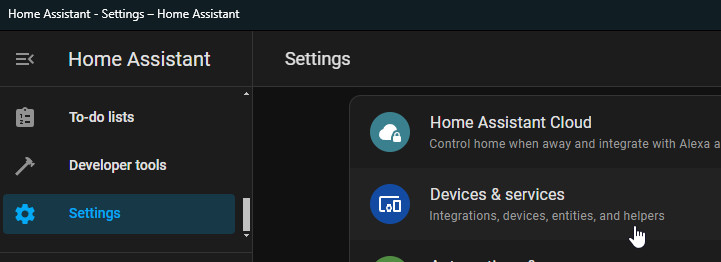
If you want to create a new sensor based on a template, you can do this in the settings under "Devices & services", "CREATE HELPER" and "Template":

Template sensor: Helper
Originally, template-sensors were stored in the configuration.yaml file. In current Home Assistant versions, the templates can be conveniently created as helpers in the Home Assistant interface. The helpers already show the calculated values or any syntax errors when they are created.
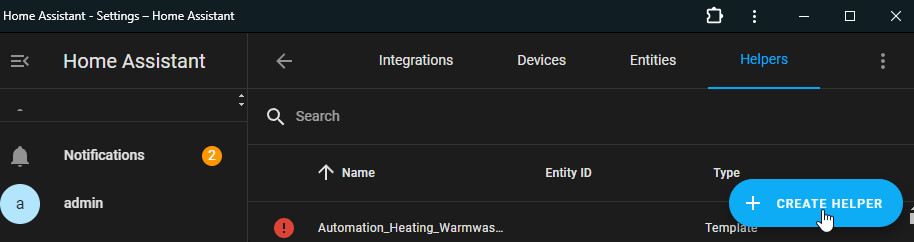
Menu item: Settings, Create helper -> Template:

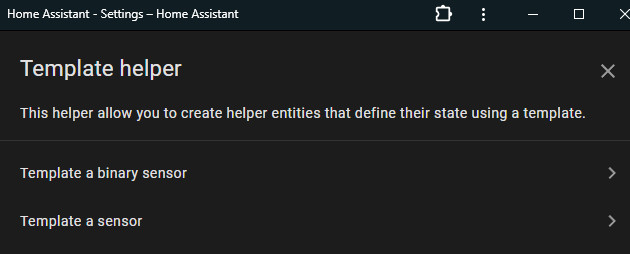
You can select the options for a binary sensor, i.e. "On" and "Off", or any other sensor:
To create, see on this page: Template examples
Automations
The template sensors created could be used in an automation, or alternatively they offer the option of storing a template block directly in the triggers or conditions:

Within the automations, templates can be used as triggers, conditions and in the conditions of actions:

See also: Home Assistant automation - possibilities & basics
Template examples
To interpret the values of certain sensors or variables, these can be written in Jinja2 within {{ and }}. Variables can be set using the following syntax: {% set variable = 1 %}. "if", "else", or "else if" statements can also be interpreted within {% and %}. Comments can be added within {# and #}.
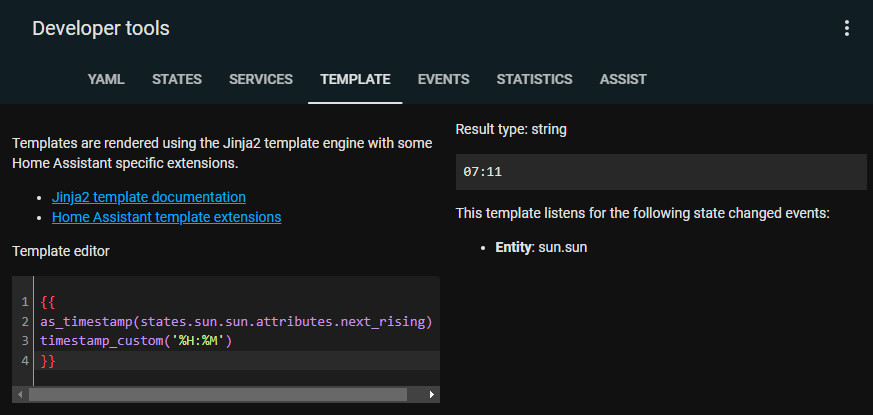
As a concrete example of a template sensor, the time could be made available as a separate entity from the date and time for the next sunrise. The integrated sensor for the sunrise is available in the following format: 2023-09-12T07:40:21.796007+00:00. The following template can be used to extract the time:
{{
as_timestamp(states.sun.sun.attributes.next_rising) |
timestamp_custom('%H:%M')
}}
"as_timestamp" thereby converts the value ("states.") of the sensor "sun.sun.attributes.next_rising" into a Unix timestamp. A pipe "|" to the function "timestamp_custom" converts the timestamp back into "hours": "minutes": '%H:%M'. As already mentioned, the template can be tested in the developer tools:
Used as a template sensor, this also shows a preview of the result:

When the template sensor is saved, a new sensor with the ID: sensor.name, in this case "sensor.sunrise", is created and is available as a separate entity in Home Assistant. For more information on template sensors and their unit of measurement, device and status class, see the following page: Home Assistant Sensors - Basics
Template - Cheat Sheet
Here are a few sample templates:
| what | Template |
|---|---|
| Sunrise |
|
| Sunset |
|
| Sun String: Sunrise - sunset |
|
| Daylight in hours per day |
|
| Test after sunrise |
|
| Test 180 Minutes after Sunrise |
|
| Test after sunset |
|
| Remaining daylight in hours |
|
| Power (Watt) from current (I) and voltage (U) |
|
| Using the current consumption of the heating control - measured with a Zigbee socket - I can determine which action the heating is currently performing. |
The following sensor changes the status based on the power consumption of the heating control and can therefore be displayed as information in a Lovelace card, for example: |
| Zeit seit der letzten Statusänderung in Minuten länger als x Minuten (im Beispiel 30 Minuten) |
To determine when the status of a sensor was last changed, I use the following template for my heating system. The template checks whether the last status change took place more than 30 minutes ago ("> 30"). I use the template in the automations so that my heating is not deactivated again shortly after being switched on by a certain status change. |
| Specify "Not available" value: 0 |
By using if and testing whether the value of the sensor is a number, the number 0 can be returned instead of "not available": |
Use previous value in template sensor
Using the following template, a template sensor (here sensor.lastavailablestate) can return the last value that was not "unavailable":
{% if states('sensor.sometimes_unavailable')  != 'unavailable'%}
    {{ sensor.sometimes_unavailable }}
{% else %}
    {{ states('sensor.lastavailablestate') }}
{% endif %}
({{pro_count}})
{{percentage}} % positive
 ({{con_count}})