Home Assistant Docker Conbee 2 and Zigbee2MQTT / deCONZ
Thanks to numerous integration options, Home Assistant is a simple platform for controlling a wide range of smart home devices. Compared to ioBroker, I found it much easier to get started with Home Assistant. While for ioBroker I was still searching for which frontend I could use for my dashboards, with Home-Assistant I had a ready-made system out of the box. Home Assistant's Lovelance dashboards can be easily clicked together in the GUI and adapted for special customizations in the code editor and with additional frontend packages almost at will.
What I use Home Assistant for
I primarily use Home Assistant to control certain lights or the awning via smartphone. I also use it to monitor the temperature and humidity of certain rooms, the water flow of my heat pump via ultrasonic sensors, the electricity, and water consumption, the front door, a NAS and a web server. In addition, I have hung something like a weather station on the wall on the basis of an old smartphone. Now I can see the temperature, the weather or other values in passing or start certain actions on it.
Hardware?
As hardware for running the Docker containers mentioned here, I use a self-built NAS, see: Building a NAS yourself: flexible, low-power and cheap [HowTo]. However, any other hardware, such as a notebook, a Raspberry PI or a Mini-PC can also be used for operation.
Home Assistant Docker vs. HAOS
If you want to run other services on the hardware besides Home Assistant, you can either run the Home Assistant Operating System (HAOS) virtually in a VM or start it as a Docker container. The latter requires fewer system resources (CPU and RAM), but loses the ability to install Home Assistant addons. Using Docker means that the add-ons cannot be installed in Home Assistant, but must also be started and managed in Docker. In return, the HA Docker image can be run consistently on the same platform alongside other services, simplifying installation backup and relocation.
Home-Assistant - Docker startup
Docker Basics
Docker allows applications to be launched by command in a so-called container.A container is an isolated environment independent of the operating system (OS):
When a container is first launched, Docker independently loads all the necessary sources
from the internet.
Docker can be installed on Windows, macOS or an Linux Distribution
docker run -d --name="home-assistant" \
-v ha:/config \
-v /etc/localtime:/etc/localtime:ro \
--net=host \
--restart=always \
homeassistant/home-assistant:stable
The network for Home-Assistant must be set to “--net=host" according to the manufacturer, but the ports used can also be defined: as an example when using a reverse proxy for access from the Internet, see: Access from the Internet - SSL Let's Encrypt.
First start: Initial configuration
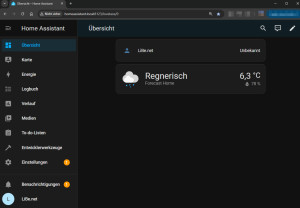
After starting the container, Home-Assistantis accessible via port 8123 by default:
If you run Docker on the same machine, you can also use http://localhost:8123 for the call, see call localhost: IP address “127.0.0.1”, “::1” | what is localhost?
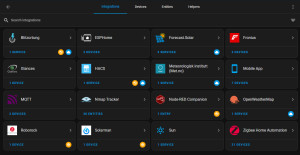
Devices and sensors can be added to HomeAssistant via so-called integrations:
Integrations
ZigBee integration with the ConBee 2 USB stick: 3 possible installation variants:
To enable me to control my ZigBee devices via Home-Assistant, I use a ConBee II USB stick. Information about the setup, see: Conbee 2: Phoscon deCONZ - Docker Startup | Review. Originally I used the manufacturer software of the ConBee 2 stick: deCONZ with the graphical user interface Phoscon. But alternatively ConBee 2 can be integrated directly into Home Assistant and as a third option via Zigbee2MQTT. With the last two variants, a cheaper ZigBee adapter can also be used, as an example: CC2652 or CC1352. When switching from one variant to the other, the end devices must be reconnected. I used deCONZ for about one year and then changed the setup to Zigbee2MQTT, which is also my recommendation from the current point of view.
1) ConBee 2 Manufacturer Software: deCONZ / Phoscon
If you already have ConBee and Phoscon in use, you have to set the Phoscon-GW to “Authenticate app” as preparation for the connection of Home Assistant:
Home Assistant already reports the detected deCONZ setup via the notification:
Alternatively, the integration can also be added in the Configuration menu item :
Details see, https://www.home-assistant.io/integrations/deconz/
2) Access to ConBee2, directly from HomeAssistant (Zigbee Home Automation: ZHA)
Alternatively to the connection of the ConBee stick via the deCONZ Zigbee gateway, the stick can also be integrated directly in Home Assistant. For this, Home Assistant, as well as the deCONZ container, must be started with the parameter “--device”:
docker run -d --name="home-assistant" \
-v ha:/config \
-v /etc/localtime:/etc/localtime:ro \
--net=host \
--restart=always \
--device=/dev/ttyACM0 \
homeassistant/home-assistant:stable
Â
Devices that were previously connected to deCONZ cannot be used at this point, they have to be connected again:
Zigbee2MQTT is another alternative to deCONZ and ZHA:
3) Independent solution: Zigbee2MQTT
Zigbee2MQTT is a Zigbee bridge for communication between Zigbee and a MQTT broker. The setup with HomeAssistant consists of three components:
- HomeAssistant
- MQTT - Broker
- Zigbee2MQTT
In Home-Assistant MQTT can be added to the integrations:
see: MQTT - Broker : Docker Setup, or my complete Docker Compose setup: Zigbee2MQTT- docker-compose.yml.
Compared to Phoscon, see: Zigbee2MQTT vs deCONZ and Phoscon.
System Monitor
To monitor the operating system - on which Home Assistant runs - in a rudimentary way, additional sensors can be added in configuration.yaml, as an example Disk and Memory:
configuraton.yaml:
sensor:
- platform: systemmonitor
resources:
- type: disk_use_percent
arg: /
- type: disk_use_percent
arg: /daten
- type: memory_free
Monitor server or Linux systems
If you want to monitor the status of other Linux systems, you can use the integration “Glances”. Glances collects data about CPU, memory or the free space of a hard disk and much more. As a prerequisite, Glances must first be installed on the systems to be monitored, see also: Glances - Monitor Linux Server
Template sensor
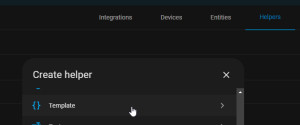
A template sensor can be used to create sensors based on certain values, e.g. for sunrise and sunset:
configuraton.yaml
sensor:
- platform: template
sensors:
nextsunrise:
friendly_name: 'Sonnenaufgang'
value_template: >
{{ as_timestamp(states.sun.sun.attributes.next_rising) | timestamp_custom(' %H:%M') | replace(" 0", "") }}
icon_template: mdi:weather-sunset-up
nextsunset:
friendly_name: 'Sonnenuntergang'
value_template: >
{{ as_timestamp(states.sun.sun.attributes.next_setting) | timestamp_custom(' %H:%M') | replace(" 0", "") }}
icon_template: mdi:weather-sunset-down
nextsunsetsunrise:
friendly_name: 'Sonne'
value_template: >
{{ as_timestamp(states.sun.sun.attributes.next_rising) | timestamp_custom(' %H:%M') | replace(" 0", "") }} - {{ as_timestamp(states.sun.sun.attributes.next_setting) | timestamp_custom(' %H:%M') | replace(" 0", "") }}
icon_template: mdi:weather-sunset-up
Platform Integration
To determine the consumption from an instantaneous value, a so-called platform integration can be used. As an example, from certain consumption values: Watt the complete consumption can be summed up:
sensor:
- platform: integration
source: sensor.waschmaschine_power
name: waschmaschine_energy_sum
unit_prefix: k
unit_time: h
round: 2
To relate the summed consumption back to a specific time period, Platform Integration can be used as “utility_meter”:
Utility_meter
The utility meter uses the total consumption and divides it into specific time periods: e.g. hourly or (daily) daily:
utility_meter:
waschmaschine_hour:
source: sensor.trockner_energy_sum
name: Waschmaschine hour
cycle: hourly
waschmaschine_daily:
source: sensor.trockner_energy_sum
name: Waschmaschine hour
cycle: daily
Shelly
Since it is easy to connect different systems with Home Assistant, I also use a WLAN switch in addition to ZigBee. Shelly is a small flush-mounted WLAN switch for controlling e.g. a power socket.
After setup, the device is automatically assigned to the default home dashboard:
Device Tracker OpenWRT
If you want to track the presence of devices via OpenWRT, you can do this with the device_tracker entry in the configuration.yaml file:
device_tracker:
- platform: luci
host: 192.168.1.2
username: root
password: ???
interval_seconds: 30
consider_home: 360
new_device_defaults:
track_new_devices: true
For OpenWRT, the package luci-mod-rpc is required for this. For information on OpenWRT, see: Alternative Router Firmware: OpenWrt and no longer DD-WRT.
Ping on a network device
If you want to track the presence of devices via OpenWrt using a ping, you can do this with the binary_sensor entry in the configuration.yaml file:
..
binary_sensor:
- platform: ping
name: FireTV
scan_interval: 120
host: 192.168.1.104
..
The status of the sensor is depending on the accessibility of the device: "off" or "on".
Connect MQTT devices as sensor
After adding the MQTT integration, a new sensor can be created in the configuration.yaml file:
MQTT requires an MQTT broker server, see MQTT - Broker : Docker Setup.
Adding individual sensors in theconfiguration.yaml file:
sensor:
- platform: mqtt
state_topic: "flowmeter/flow"
name: "flowmeter"
unit_of_measurement: "mÂł/h"
Home-Dashboard
All connected devices are automatically displayed in the home dashboard.
Of course, the dashboards can also be created and customized by yourself.
History
In the history, the historical data of the individual devices are automatically prepared:
The default history settings are 10 days, after which historical values are deleted from the database:
Setting: purge_keep_days integer (optional, default: 10) in the configuration.yaml file:
recorder:
purge_keep_days: 10
see, www.home-assistant.io/integrations/recorder/, or to use a database other than SQLite: Home Assistant database MySQL vs. SQLite and for connecting an InfluxDB, see: InfluxDB: Time series database - Docker and for visualizing: Grafana: Docker - Visualize data and define alarms.
Home Assistant Community Store (HACS)
Actually I just wanted to add a RGB light to the dashboard, works but without the possibility to change the color: At this point I would have expected more. The research and installation of an integration for controlling colors took me much more time than the actual Home Assistant installation. But in return, HACS gave me the foundation for further customization. HACS is an integration to download GitHub repositories via a kind of software catalog.
I installed HACS via a command in the Docker container:
user@rechner:~$ docker exec -it home-assistant bash
bash-5.0# wget -q -O - https://install.hacs.xyz | bash -
then on settings, integrationÂ
and then the installation has to be registered on GitHub, see: hacs.xyz/docs/configuration/basic
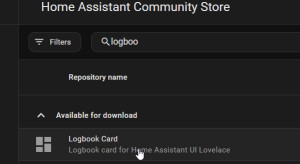
Once HACS is installed, adding additional repositories is relatively easy:
HACS: Must-have frontend packages
Adding resources - RGB Light Card
If you have RGB lights in use, you can use the RGB Light Card to change the colors:
apexcharts-card
Besides the RGB Light Card, I also installed apexcharts-card. With this package you can create much more appealing graph cards:
Plotly Graph Card
Wer fĂĽr Charts eine Zoom- und Scroll-Funktion sucht, sollte sich Plotly Graph Card ansehen:
lovelance-card-mod
With "lovelance-card-mod" elements in Home Assistant can be customized via CCS styles:
lovelance-layout-card
The extension "layout-card" allows customizing the areas in the dashboards, if needed also depending on the screen resolution. As a very simple example, I use two columns for a screen width larger than 600px, smaller 600px only one column:
Notification to cell phone - Alarm
The Android app “Home Assistant” offers besides numerous cell phone sensor values in Home Assistant also a very simple way to receive notifications from Home Assistant: https://play.google.com/store/apps/details?id=io.homeassistant.companion.android&hl=de_AT&gl=US.
If you install the app, you will notice that Home Assistant regularly notifies you about updating the cell phone sensors to HomeAssistant:
Refresh Sensors.
By default, a notification with “Update sensors” is displayed every 15 minutes:
The notice can be easily removed by long pressing on the notification and disabling the “SensorWorker”:
Deactivating the SensorWorker does not affect the notifications stored in the automations, they still remain active. To receive a notification when an event occurs, an automation can be created for this purpose by clicking on “Configuration” and “Automation”:
Notification when a certain value is reached
As an example, I created a notification for monitoring the humidity:
I created a new automation for this notification in Configuration / Automation:
The notification can be tested later with “RUN ACTIONS”, but first to the settings of this automation:
service: notify.mobile_app_sm_a405fn
data:
title: Luftfeuchtigkeit Bad
message: >-
Luftfeuchtigkeit: {{states('sensor.bad_2')}}%
Temperatur:{{states('sensor.bad')}}°C
Access via the Internet https-ssl (Let's-Encrypt) and Docker Compose.
Thanks to Let's Encrypt, Home Assistant can very easily be provided with an SSL certificate and thus be operated securely on the Internet. As a prerequisite for this, I have the following setup in use: Traefik in Docker | multiple web servers incl. certificate SSL.
For the operation with the reverse proxy I made the following settings in the configuration:
configuration.yaml:
http:
server_port: 80
use_x_forwarded_for: true
trusted_proxies:
- 127.0.0.1
- ::1
- 172.18.0.0/16
I use the “webproxy” network for the web containers that are accessible from the Internet via the Let's Encrypt reverse proxy. Accordingly, I created the following docker-compose file for Home Assistant:
docker-compose.yml
version: "3"
services:
hass:
image: homeassistant/home-assistant:stable
container_name: home-assistant
#Labels for ReverseProxy, see: https://www.libe.net/en-traefik
labels:
- "traefik.enable=true"
- "traefik.http.routers.ha.rule=Host(`ha.domain.tld`)"
- "traefik.http.routers.ha.entrypoints=web"
- "traefik.http.routers.ha.entrypoints=websecure"
- "traefik.http.routers.ha.tls.certresolver=myresolver"
- "traefik.http.services.ha.loadbalancer.server.port=8123"
restart: always
volumes:
- ./haconfig:/config
- /etc/timezone:/etc/timezone:ro
- /etc/localtime:/etc/localtime:ro
expose:
- "8123"
#For direct test access, remove "#" in the following 2 lines. Call: http://localhost:8123 or http://ServerIP:8123
#ports:
#- "8123:8123"
#Without using a reverse proxy (https://www.libe.net/en-traefik) the webproxy network is likely to be missing
#and the following lines can be removed or commented out. Alternatively, the network can be created with "docker network create webproxy".
networks:
default:
external:
name: webproxy
For direct access via IP address or localhost - even without reverse proxy, DNS or public IP - the commented out port setting can be activated for test purposes by removing “#“ in front of “ports:” and “-"83:80"“ .
For Internet access via the Traefik reverse proxy, the domain must be replaced in the labels with the previously created DNS entries (in the example: ha.domain.tld). To make it easier to transfer or back up relevant container data, the example uses bind mounts rather than Docker Volumes to permanently store the data. See: Docker data storage: Docker Volumes vs. Host Folders and Practice: backup Docker container data: Volumes / Bind Mounts.
deCONZ and Home-Assistant in a docker-compose.yml-file
So that also the Conbee 2 stick can be addressed, I have added deCONZ
version: "3"
services:
hass:
image: homeassistant/home-assistant:stable
container_name: home-assistant
labels:
- "traefik.enable=true"
- "traefik.http.routers.ha.rule=Host(`ha.domain.tld`)"
- "traefik.http.routers.ha.entrypoints=web"
- "traefik.http.routers.ha.entrypoints=websecure"
- "traefik.http.routers.ha.tls.certresolver=myresolver"
- "traefik.http.services.ha.loadbalancer.server.port=8123"
restart: always
volumes:
- ./ha:/config
- /etc/timezone:/etc/timezone:ro
- /etc/localtime:/etc/localtime:ro
expose:
- "8123"
deconz:
image: marthoc/deconz
container_name: deconz
environment:
DECONZ_DEVICE: '/dev/ttyACM0'
DECONZ_VNC_MODE: '1'
DECONZ_VNC_PORT: '5900'
DECONZ_VNC_PASSWORD: 'password'
restart: always
volumes:
- ./deconz:/root/.local/share/dresden-elektronik/deCONZ
- /etc/timezone:/etc/timezone:ro
- /etc/localtime:/etc/localtime:ro
devices:
- /dev/ttyACM0
ports:
- 83:80
- 5983:5900
networks:
default:
external:
name: webproxy
After about a year with deCONZ I switched to Zigbee2MQTT, accordingly I removed deCONZ in the following example and put Zigbee2MQTT and MQTT together with Home-Assistant in a docker-compose file:
Alternatively: Zigbee2MQTT, MQTT and Home-Assistant in a docker-compose.yml file
My complete setup, consisting of HomeAssistant, MQTT and Zigbee2MQTT, assuming a running Let´s Encrypt reverse proxy, currently looks like this:
version: "3"
services:
hass:
image: homeassistant/home-assistant:stable
container_name: home-assistant
labels:
- "traefik.enable=true"
- "traefik.http.routers.ha.rule=Host(`ha.domain.tld`)"
- "traefik.http.routers.ha.entrypoints=web"
- "traefik.http.routers.ha.entrypoints=websecure"
- "traefik.http.routers.ha.tls.certresolver=myresolver"
- "traefik.http.services.ha.loadbalancer.server.port=8123"
restart: always
volumes:
- ./haconfig:/config
- /etc/timezone:/etc/timezone:ro
- /etc/localtime:/etc/localtime:ro
expose:
- "8123"
mosquitto:
image: eclipse-mosquitto
container_name: mqtt
restart: always
volumes:
- ./mosquitto/config:/mosquitto/config
- ./mosquitto/data:/mosquitto/data
- ./mosquitto/log:/mosquitto/log
ports:
- "1883:1883"
- "9001:9001"
zigbee2mqtt:
container_name: zigbee2mqtt
restart: always
image: koenkk/zigbee2mqtt
volumes:
- ./mqtt:/app/data
- /run/udev:/run/udev:ro
ports:
- 83:8080
environment:
- TZ=Europe/Vienna
devices:
- /dev/ttyACM0
networks:
default:
external:
name: webproxy
InfluxDB and Grafana
In order to store long-term values for my heating and to be able to visualize them better, I also use an InfluxDB for storing the data and Grafana for evaluating it. The connection of the Influx-DB here is done via the Home-Assistant config file configuration.yml
...
influxdb:
include:
entities:
- sensor.1...
- sensor.2...
host: influxdb
port: 8086
database: ha
username: ha
password: ???
max_retries: 3
Version 1 uses a username and password for the connection, version 2: token, organization and bucket.
Since I don't want to evaluate all data in Grafana, I used “include” to store only certain sensors. The complete Docker setup for Home Assistant, MQTT, Zigbee2MQTT, InfluxDB and Grafana looks like this:
version: "3"
services:
hass:
image: homeassistant/home-assistant:stable
container_name: home-assistant
labels:
- "traefik.enable=true"
- "traefik.http.routers.ha.rule=Host(`ha.domain.tld`)"
- "traefik.http.routers.ha.entrypoints=web"
- "traefik.http.routers.ha.entrypoints=websecure"
- "traefik.http.routers.ha.tls.certresolver=myresolver"
- "traefik.http.services.ha.loadbalancer.server.port=8123"
restart: always
volumes:
- ./haconfig:/config
- /etc/timezone:/etc/timezone:ro
- /etc/localtime:/etc/localtime:ro
expose:
- "8123"
mosquitto:
image: eclipse-mosquitto
container_name: mqtt
restart: always
volumes:
- ./mosquitto/config:/mosquitto/config
- ./mosquitto/data:/mosquitto/data
- ./mosquitto/log:/mosquitto/log
ports:
- "1883:1883"
- "9001:9001"
zigbee2mqtt:
container_name: zigbee2mqtt
restart: always
image: koenkk/zigbee2mqtt
volumes:
- ./mqtt:/app/data
- /run/udev:/run/udev:ro
ports:
- 83:8080
environment:
- TZ=Europe/Vienna
devices:
- /dev/ttyACM0
influxdb:
container_name: influxdb
restart: always
image: influxdb
volumes:
- ./influxdb:/var/lib/influxdb
ports:
- 8086:8086
grafana:
container_name: grafana
restart: always
image: grafana/grafana
volumes:
- ./grafana:/var/lib/grafana
ports:
- 3000:3000
networks:
default:
external:
name: webproxy
see also: InfluxDB: Time series database - Docker and Grafana: Docker - visualize data and define alarms.
Troubleshooting - deCONZ
EVENTS
In the Developer Tools, the “EVENTS” tab can be used to observe which devices trigger an action, for example when a button is pressed:
deconz_event
The configuration flow could not be loaded
Running deCONZ in Docker can cause the IP address of the deCONZ container to change on restart. Homeassistant does not use the name of the container for the connection, but its IP address, therefore the connection does not work anymore then:
The setting in the .storage/core.config_entries file then points to an incorrect IP address:
Marquee control - grayed out
I initially had the problem that my awning could only be moved in one direction.
According to Phoscon the ZigBee switch is the model FB56+CUR17SB2.2(Heiman).
Advanced mode is needed to adjust certain settings.
Settings: Customization
This allows to change certain attributes in the settings, in my case “assumed_state”.
The file customize.yaml is thereby filled as follows:
cover.window_covering_device_10:
assumed_state: true
In order for the settings to be loaded, the file must still be specified in configuration.yaml:
homeassistant:
customize: !include customize.yaml
Then restarted the Docker container and lo and behold, now the other direction works as well:
Edit data from wrong entries directly in the database
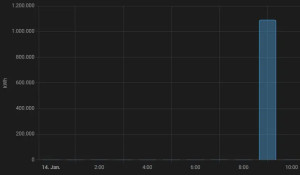
When integrating my water meter, I changed the unit from mÂł/h to liters and played wrong values into the database. The SQLite database can be read and edited via Linux board means with the command sqlite. Attention please make a backup of the database, before delete or update statements are executed. First, I connect to the Docker container of Home Assistant:
docker exec -it home-assistant /bin/bash
In the Docker container, sqlite can be installed and the database can be connected with the following command:
bash-5.1# apk add sqlite
bash-5.1# sqlite3 /config/home-assistant_v2.db
Connecting to the database allows any database queries to be executed. As an example, certain entries can be output with "select" or deleted with "delete":
sqlite> select * from states where entity_id = "sensor.water_value" and last_updated < "2022-12-22 22:56:48.421279";
sqlite> delete from states where entity_id = "sensor.water_value" and last_updated < "2022-12-22 22:56:48.421279";
sqlite> delete from states where entity_id = "sensor.water_state" and state > "890100";
Conclusion
Thanks to the fast startup and easy implementation of new ideas, I am currently more than satisfied with Home Assistant and have replaced my previously created setup consisting of ioBroker, InfluxDB and Grafana with Home Assistant. For most dashboards I use HomeAssistant and only for certain visualizations I have InfluxDB and Grafana in addition. For a comparison with other smart home platforms, see: Smart Home Platform: Systems

{{percentage}} % positive

THANK YOU for your review!
Top articles in this section
To synchronize contacts, appointments, and photos of my NAS, I tested Nextcloud and thus turned my back on other cloud providers for my private data. Thanks to Docker, the installation is easier and more flexible than ever, allowing Nextcloud to run on almost any hardware.
Bitwarden is a web-based password manager, similar to LastPass, but open source and the ability to run (host) it yourself. How Bitwarden compares to other password managers, I have considered on the following page: Password Managers Secure? KeePass vs LastPass vs Bitwarden. Bitwarden consists of several services, which can be provided via different containers. The relatively complex setup has been simplified with "Bitwarden Unified" especially for self-hosting by packing all services into one co...
Zigbee2MQTT is an open source Zigbee bridge which can be easily integrated into existing smart home solutions thanks to the MQTT network protocol. As an example, Zigbee2MQTT combined with MQTT broker Mosquitto and Home Assistant can collect, display, record and control data from Zigbee devices. The setup described here uses Docker as a base. Manufacturer's website: https://www.zigbee2mqtt.io